
Figures & data
Table 1 Characteristics of study population
Table 2 Correlation and agreement between lung emphysema by cardiac and chest CT (n=156)
Figure 1 Association between lung density indices measured by cardiac and chest CT.
Abbreviations: CT, computed tomography; PD15, 15th percentile density index.
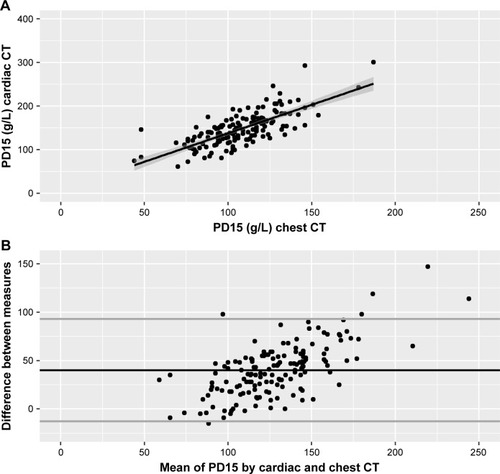
Figure 2 Association between lung density indices measured by chest (A) and cardiac (B) CT and FEV1%-predicted.
Abbreviations: CT, computed tomography; %LAA-950, percent low attenuation area ≤950 Hounsfield units.
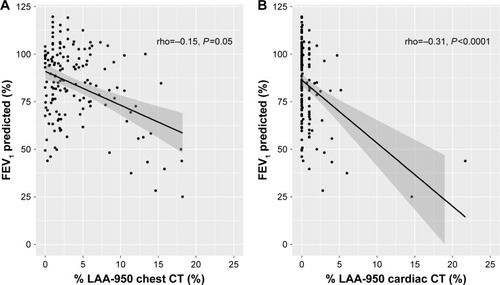
Figure 3 ROC curves for the ability of lung density indices to discriminate airflow limitation.
Abbreviations: AUC, area under the curve; %LAA-950, percent low attenuation area ≤950 Hounsfield units; LLN, lower limit of normal; PD15, 15th percentile density index; ROC, receiver operating characteristics.
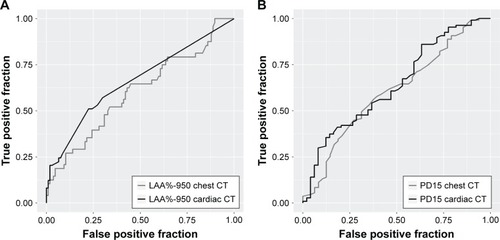
Figure 4 Association between visually and quantitatively assessed lung emphysema by cardiac and chest CT.
Abbreviations: CT, computed tomography; %LAA-950, percent low attenuation area ≤950 Hounsfield units; PD15, 15th percentile density index.
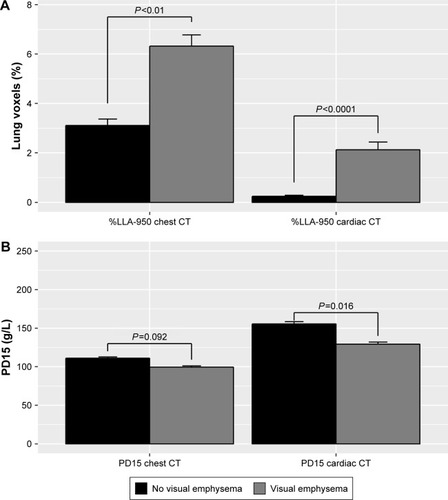
Figure S1 Emphysema quantification by cardiac CT.
Notes: Male aged 54 years with emphysema (cardiac CT %LAA-950 =14.6% and chest CT %LAA-950 =18.2%). (A) Lung segmentation by chest CT; (B) lung volume segmentation by cardiac CT; and (C) axial cardiac CT slice; red pixels indicate LAAs.
Abbreviations: CT, computed tomography; %LAA-950, percent low attenuation area ≤950 Hounsfield units.
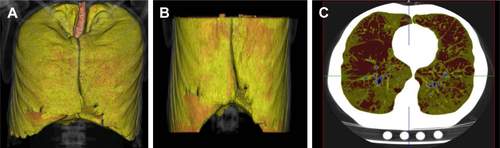
Table S1 Correlation and agreement between lung emphysema by cardiac and chest CT for individuals without HIV infection (n=51)