Figures & data
Figure 1 Flowchart for the recruited patients.
Abbreviations: HRCT, high-resolution computed tomography; CAT, COPD assessment test.
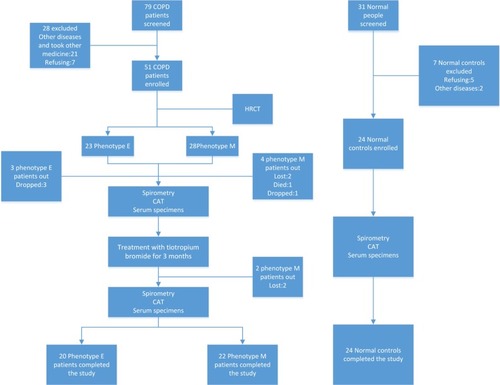
Table 1 HRCT classification of COPD
Table 2 Characteristics of all subjects
Figure 2 We chose one spectrum from each experimental group.
Note: Spectra A, B, C, D, and E were selected from normal controls, phenotype E of pre-therapy, phenotype E of post-therapy, phenotype M of pre-therapy, and phenotype M of post-therapy, respectively.
Abbreviations: EB, phenotype E in pre-therapy; EA, phenotype E in post-therapy; MB, phenotype M in pre-therapy; MA, phenotype M in post-therapy; N, normal control.
Abbreviations: EB, phenotype E in pre-therapy; EA, phenotype E in post-therapy; MB, phenotype M in pre-therapy; MA, phenotype M in post-therapy; N, normal control.
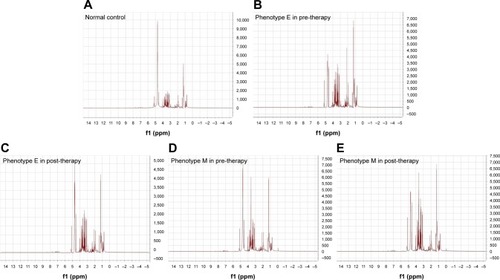
Table 3 Parameters for the evaluation of OPLS-DA model
Figure 3 Six OPLS-DA score plots are selected from six comparative groups.
Abbreviations: OPLS-DA, orthogonal partial least square discriminant analysis; EB, phenotype E in pre-therapy; EA, phenotype E in post-therapy; MB, phenotype M in pre-therapy; MA, phenotype M in post-therapy; N, normal control.
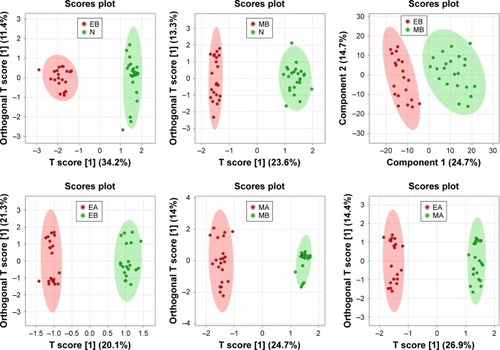
Table 4 Variation trend of the metabolites of COPD and normal controls
Table 5 Variation trend of the metabolites of COPD phenotypes
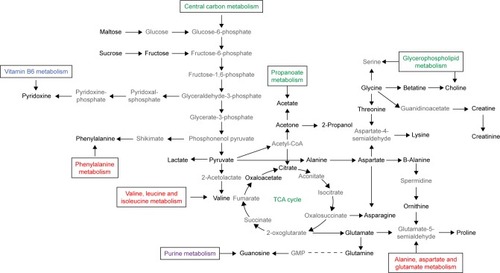
Figure 4 Analysis of metabolic pathways.
Notes: Gray represents undetected metabolites. Black represents the metabolites that have significant difference. Red is amino acid metabolic pathway. Green is carbohydrate and lipid metabolic pathway. Purple is the metabolic pathway of genetic material. Blue is vitamin metabolic pathway.
Abbreviations: TCA cycle, tricarboxylic acid cycle; GMP, guanosine monophosphate.
Abbreviations: TCA cycle, tricarboxylic acid cycle; GMP, guanosine monophosphate.