
Figures & data
Figure 1 Two-compartment integer-order model used to analyze respiratory impedance.
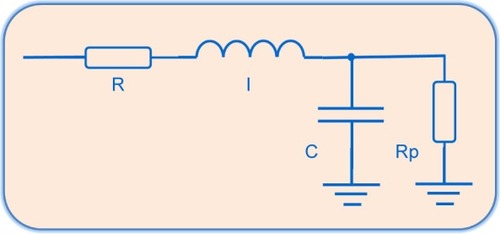
Figure 2 Two-compartment fractional-order model evaluated in this study.
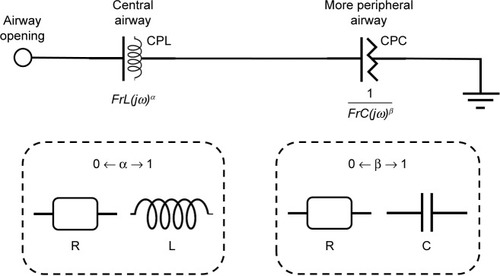
Table 1 Anthropometric, spirometric and traditional FOT measurements of the groups studied
Figure 3 Typical results obtained during the eRIC (red) and FrOr (blue) models adjustment in the resistance (closed circles) and reactance (open circles) of normal subjects (A) normal subjects with increasing resistance (B), smokers (C) and mild COPD patients (D).
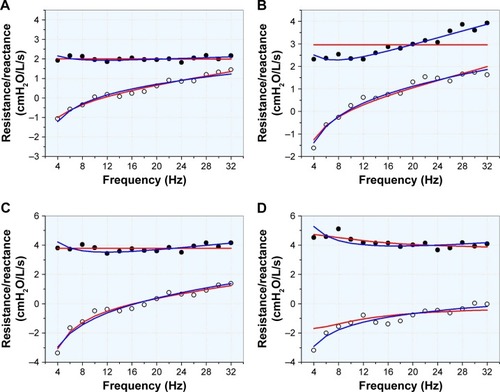
Figure 4 Changes in the eRIC model parameters in the studied groups.
Abbreviations: COPD I, mild COPD; ns, not significant.
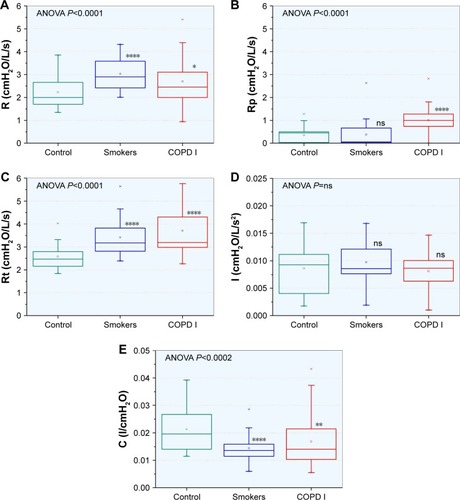
Figure 5 Changes in the fractional order model parameters in the studied groups.
Abbreviations: COPD I, mild COPD; ns, not significant.
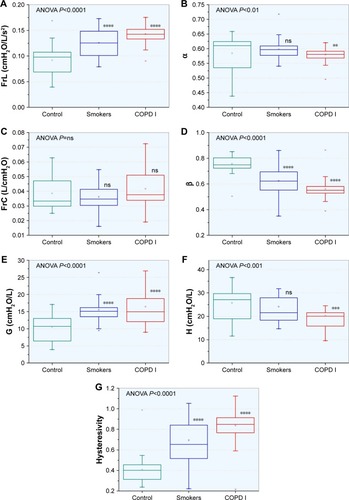
Table 2 Errors in the integer and FrOr models used for control individuals, smokers and patients with mild COPD
Table 3 Correlation analysis among traditional forced oscillation parameters and spirometric results
Table 4 Correlation analysis among eRIC model parameters and spirometric results
Table 5 Correlation analysis among FrOr model parameters and spirometric results
Table 6 Diagnostic accuracy, sensitivity, specificity and cut-off point for the traditional, eRIC and FrOr parameters in detecting respiratory alterations in smokers
Figure 6 ROC curves for the most accurate traditional FOT, eRIC and FrOr parameter in smokers (A) and mild COPD patients (C). Associated comparative analysis of these AUCs and the standard errors in smokers (B) and mild COPD patients (D) are also described.
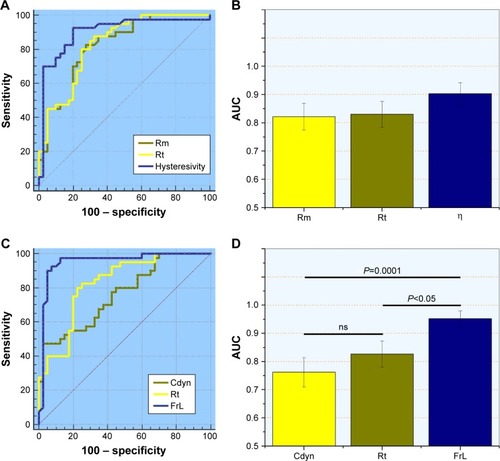
Table 7 Diagnostic accuracy, sensitivity, specificity and cut-off point for the traditional, eRIC and FrOr parameters in detecting respiratory alterations in patients with mild COPD