
Figures & data
Figure 1 Study design.
Abbreviations: AECOPD, acute exacerbations of COPD; PCR, polymerase chain reaction.
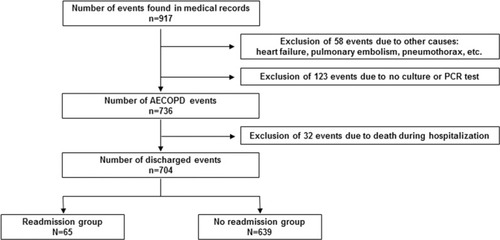
Table 1 Baseline characteristics in readmission and no-readmission groups before and after propensity score matching
Table 2 Pulmonary medication or treatment in readmission and no-readmission groups before and after propensity score matching
Table 3 Identified pathogen in readmission events and no-readmission groups before and after propensity score matching
Table 4 Multivariate analysis of Pseudomonas aeruginosa identification rate after propensity score matching