Figures & data
Figure 1 Assessment procedures at day 1 (T1) and day 2 (T2 reassessment).
Abbreviations: Dyspnea, perceived dyspnea; end-, measure taken immediately after test completion; 6MWT, six-minute walk test; 30sec-STS, 30-second sit-to-stand test; SpO2, arterial oxygen saturation as measured by pulse oximetry.
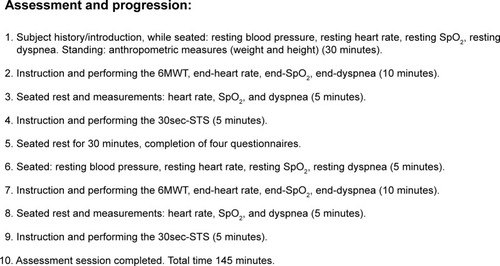
Table 1 Characteristics
Table 2 Intra-rater reproducibility test-day 1 (T1)
Figure 2 Bland–Altman plots of the 6MWD and 30sec-STS.
Notes: Mean difference between tests/or raters (dotted line) with limits of agreement 95% CI (black lines). The dashed line is the regression of change against the mean value. (A) 6MWD scores against 6MWD difference from a single rater at test-day 1 (T1). (B) 30sec-STS scores against 30sec-STS difference from a single rater at test-day 1 (T1). (C) 6MWD score difference obtained by two different raters on two separate test-days (T2 vs T1). (D) 30sec-STS score difference obtained by two different raters on two separate test-days (T2 vs T1).
Abbreviations: 30sec-STS, 30-second sit-to-stand test; 6MWD, 6-minute walk distance.
Abbreviations: 30sec-STS, 30-second sit-to-stand test; 6MWD, 6-minute walk distance.
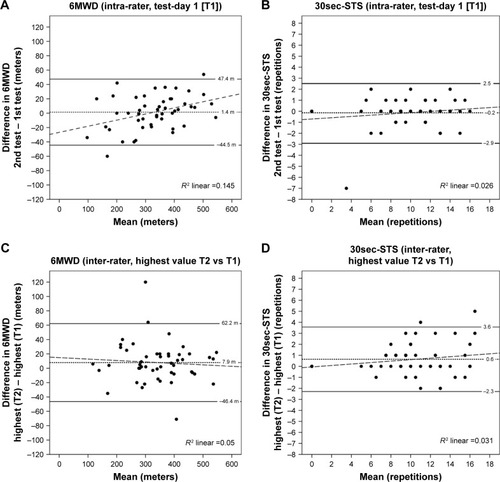
Table 3 Inter-rater reproducibility (highest value T1 vs highest value T2)
Table 4 Explorative results for 6MWD
Table 5 Explorative results for 30sec-STS
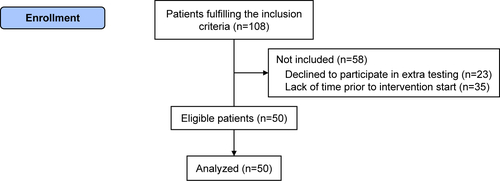
Figure S1 Recruitment flowchart.