
Figures & data
Table 1 Demographic and clinical characteristics of the patients included in the analysis of predictors of mortality according to FEV1 (GOLD classification of FEV1 severity) of COPD at baseline
Figure 1 Flowchart of all patients included in the study.
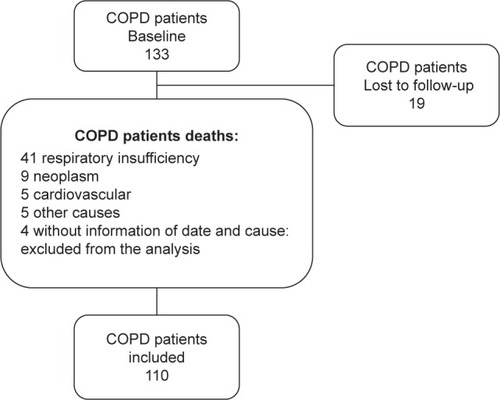
Figure 2 Medication classes used at baseline according to the GOLD classification.
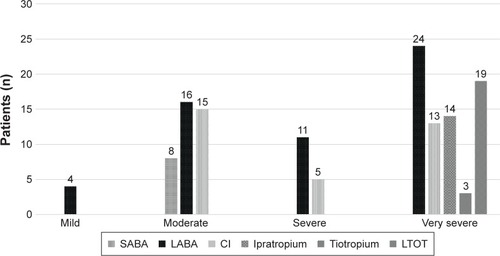
Figure 3 Causes of death according to severity of COPD.
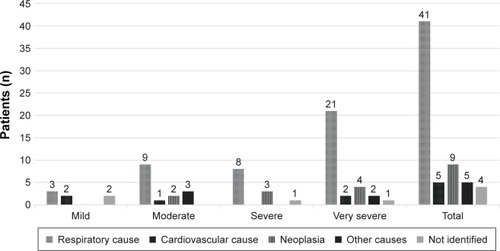
Table 2 Comparison between the baseline characteristics according to survival status (survivors vs non-survivors) after 9 years
Figure 4 Kaplan–Meier survival curves of all patients according to BODE index classification (A) body mass index (B) and 2004 GOLD severity classification (C).
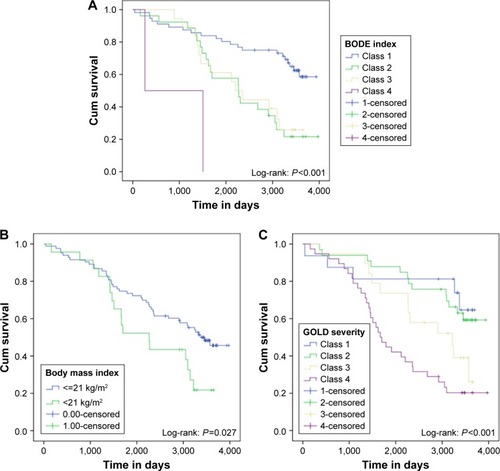
Table 3 Cox regression analysis to identify the predictors of mortality in the 9-year period
Table 4 Cox regression analysis with replacement of the BODE index for the variables that compose it
Table S1 Cox regression analysis with GOLD severity classification to identify the predictors of mortality in the 9-year period
Table S2 Cox regression analysis with replacement of the BODE index for the variables that compose it, without patients with neoplasm, to identify the predictors of mortality in the 9-year period