Figures & data
Table 1 Baseline demographic characteristics of participants with valid PA assessments (by site)
Figure 1 CONSORT diagram of patient flow through the study.
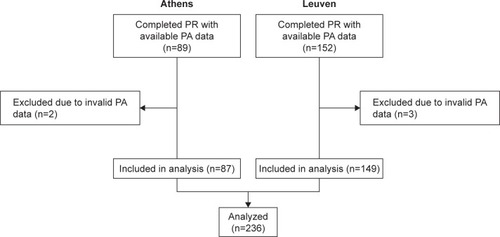
Table 2 Characteristics of “PA responders” (>1,000 steps/day) vs “nonresponders”
Figure 2 Changes in PA levels and six-minute walk distance, according to group.
Abbreviations: PA, physical activity; 6MWDi, initial six-minute walk distance.
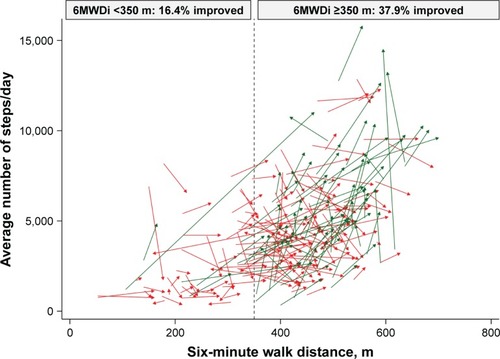
Figure 3 Change in physical activity (mean steps/day) over initial six-minute walk distance groups.
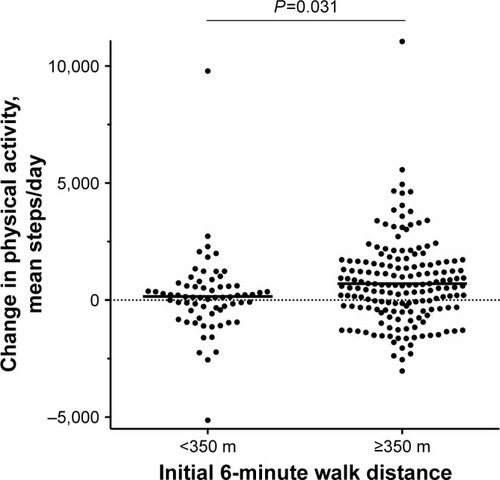
Table 3 Logistic regression analysis to predict physical activity “responders” (Δ1,000 steps/day) at 3 months
Table S1 Pulmonary rehabilitation responses
Figure S1 Pearson correlation between 6MWDi and change in PA (steps/day).
Notes: Proportion of PA responders, according to 6MWDi groups (vertical dashed line), denoted by the ratio of dots above vs below the horizontal dashed line. The horizontal dashed line represents a change in PA of more than 1,000 steps/day.
Abbreviations: 6MWDi, initial 6-minute walk distance; PA, physical activity.
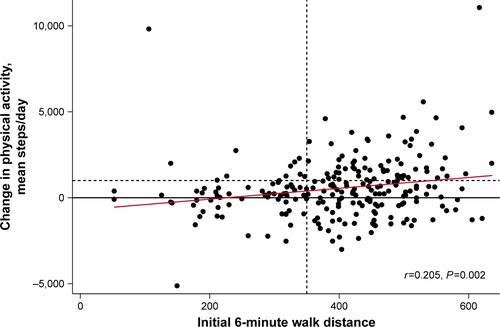
Figure S2 Pearson correlation between changes in PA levels and changes in exercise tolerance at 3 months.
Notes: Closed circles represent patients with 6MWDi of <350 m; open circles represent patients with 6MWDi of at least 350 m. Horizontal dashed line represents the proposed minimally important difference threshold for improvement in PA after PR (1,000 steps/day).
Abbreviations: 6MWDi, initial 6-minute walk distance; PA, physical activity; PR, pulmonary rehabilitation.
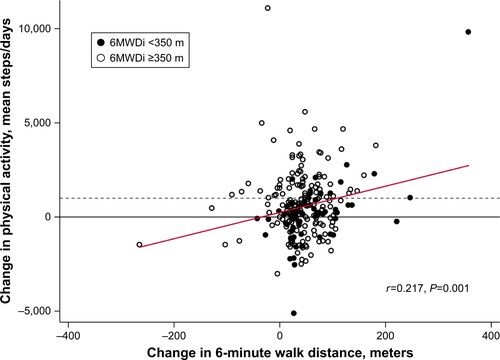
Figure S3 ROC curve of 6MWDi cutoff to identify PA responder.
Notes: Arrow denotes 350 m cutoff reference value corresponding with 85.33% sensitivity; 34.78% specificity; 50.85% correctly classified; +ve likelihood ratio 1.308; -ve likelihood ratio 0.422.
Abbreviations: 6MWDi, initial 6-minute walk distance; PA, physical activity; ROC, receiver operator curve.
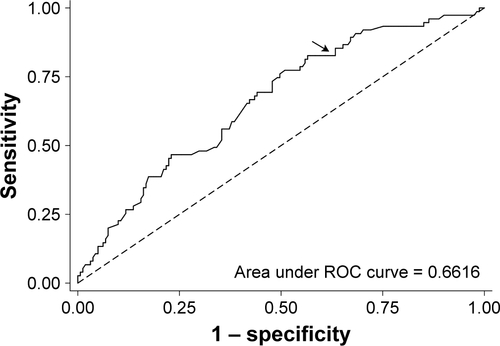
Figure S4 Changes in physical activity across the two 6MWDi groups, expressed as percent change from baseline.
Notes: Horizontal bars denote group means. Percentage change derived from mean steps/day weekly count. Horizontal dashed lines represent the point of zero change.
Abbreviation: 6MWDi, initial 6-minute walk distance.
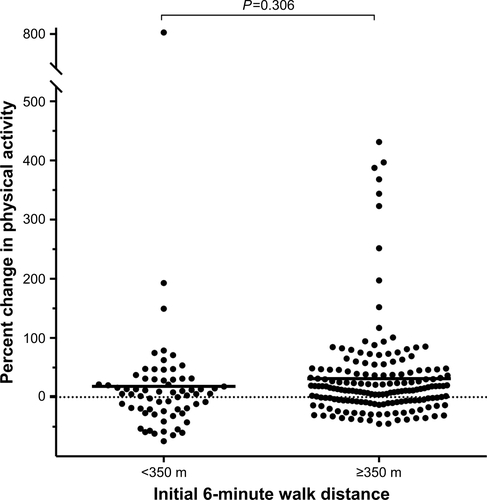
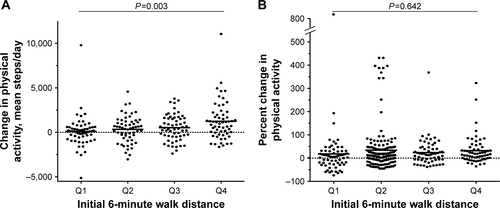
Figure S5 Changes in physical activity across 6MWDi quartiles.
Notes: (A) Change in physical activity expressed as steps/day. (B) Change in physical activity expressed as percent change from baseline, derived from mean steps/day weekly count. Horizontal dashed lines represent the point of zero change. P-value denotes result from one-way ANOVA test.
Abbreviation: 6MWDi, initial 6-minute walk distance.