
Figures & data
Table 1 Clinical characteristics of the patients
Figure 1 The flowchart for screening patients.
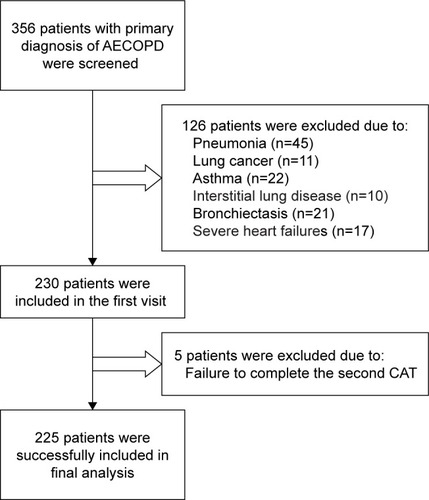
Table 2 Changes in CAT scores between the two visits in different health statuses
Figure 2 The comparison of the changes in CAT score in AECOPD patients with different health statuses.
Abbreviations: AECOPD, acute exacerbation of COPD; CAT, COPD assessment test.
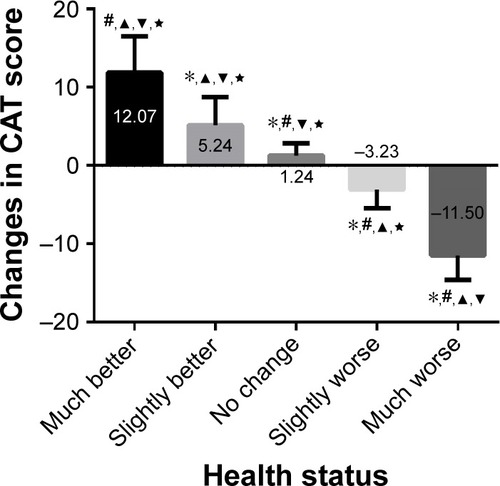
Table 3 Changes in CAT scores between responders and nonresponders
Table 4 The correlation between CAT score and health status, and improvement in FEV1% and FEV1
Figure 3 Relationship between the CAT score at admission and length of hospital stay.
Abbreviation: CAT, COPD assessment test.
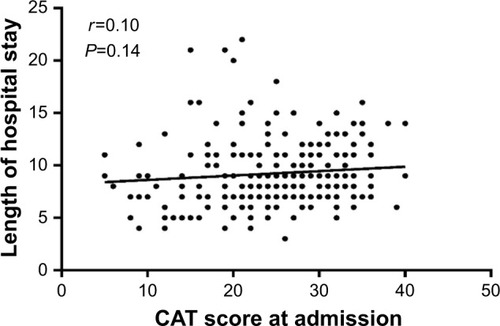
Figure 4 Relationship between the CAT score at the second visit and length of hospital stay.
Abbreviation: CAT, COPD assessment test.
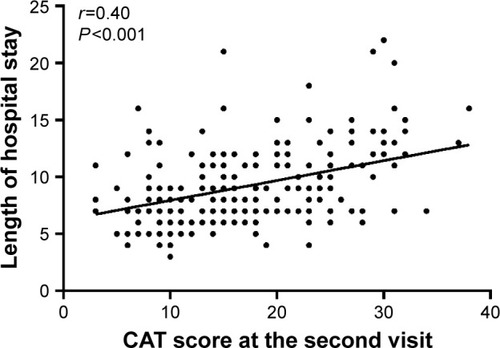
Figure 5 Relationship between the changes in CAT score and length of hospital stay.
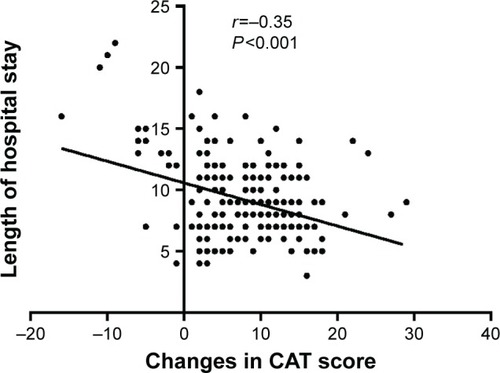
Figure 6 The ROC curve for the cutoff point of CAT score improvements to differentiate responders and nonresponders.
Notes: The AUC was 0.973; the sensitivity and specificity were 86.9% and 97.4%, respectively.
Abbreviations: AUC, area under the curve; CAT, COPD assessment test; ROC, receiver operating characteristic.
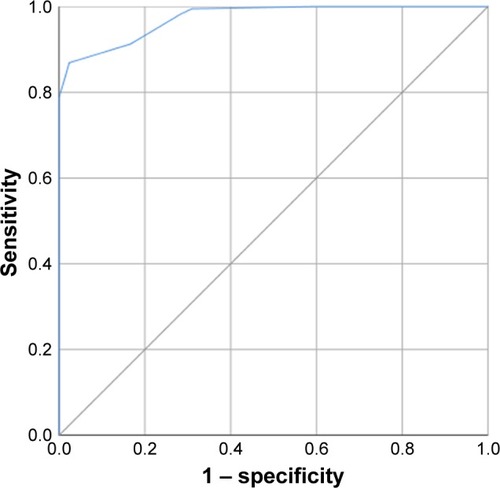
Figure 7 The ROC curve for the cutoff point of CAT score improvements to differentiate between patients in the slightly better group and no-change group.
Abbreviations: AUC, area under the curve; CAT, COPD assessment test; ROC, receiver operating characteristic.
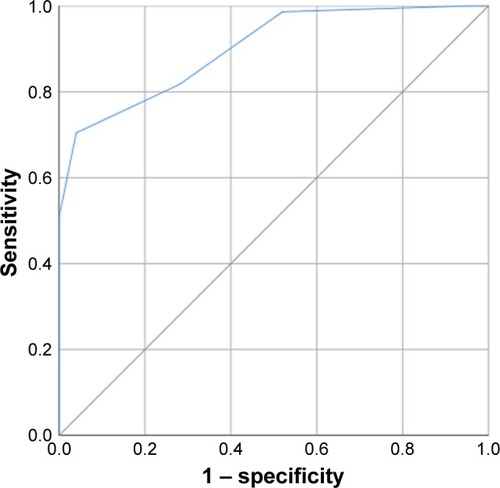
Figure S1 The number of the patients who received standard treatment.
Notes: This was a one-year follow-up study. In total, 189 patients were recruited into our study. All of them accepted three visits after being recruited (at 3 months, at 6 months, and at 12 months). If the patients reported they took their drugs everyday based on the prescription at every visit, they would be classified as those who received regular treatment. The rest were those who didn’t receive regular treatment. We found that only one-third of the patients received regular treatment.
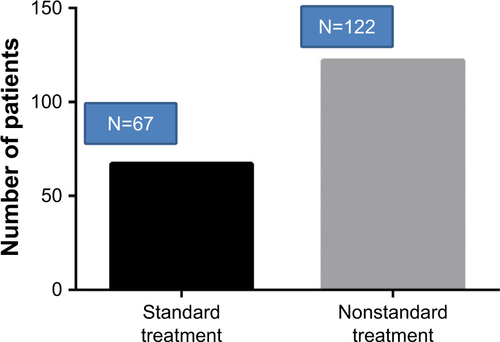
Table S1 The detailed information of the comorbidities of patients who reported no change