Figures & data
Table 1 Characteristics of all included subjects
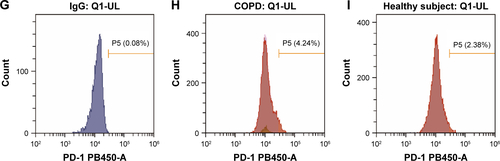
Figure 1 GLP-1R level in PBMCs of COPD patients and non-COPD subjects.
Notes: (A) qRT-PCR analysis of GLP-1R gene expression of COPD patients (n=40) and non-COPD subjects (n=35). The hGLP-1R mRNA level was normalized to GAPDH control and multiplied by 104. Data are expressed as mean ± SEM. ****P<0.0001 vs non-COPD. (B) Representative Western blot analysis for GLP-1R protein. (C) Fold change of densitometric analysis obtained from samples derived from COPD patients normalized to the average quantification of samples derived from non-COPD subjects. Numbers 1–7 represent individuals with COPD, and numbers I–V represent individuals with non-COPD. Data are expressed as mean ± SEM. *P<0.05 vs non-COPD. The statistical significance of differences observed was determined by Mann–Whitney test.
Abbreviations: GAPDH, glyceraldehyde-3-phosphate dehydrogenase; GLP-1R, glucagon-like peptide-1 receptor; PBMCs, peripheral blood mononuclear cells; qRT-PCR, quantitative real-time PCR; SEM, standard error of the mean.
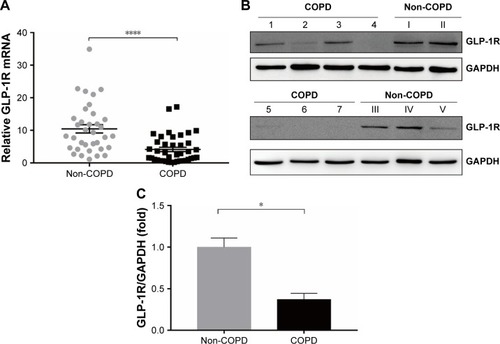
Figure 2 GLP-1R and IFN-γ expression of PBMCs from COPD patients.
Notes: (A) Correlation between predicted FEV1% and GLP-1R mRNA expression in PBMCs of COPD patients. (B) Correlation between FEV1/FVC% and GLP-1R mRNA expression in PBMCs of COPD patients. (C) Correlation between IFN-γ mRNA expression and GLP-1R mRNA expression in PBMCs of COPD patients. (D) Correlation between predicted FEV1% and IFN-γ mRNA expression in PBMCs of COPD patients. (E) Correlation between FEV1/FVC% and IFN-γ mRNA expression in PBMCs of COPD patients. (F) qRT-PCR analysis of IFN-γ mRNA expression in PBMCs of COPD patients and non-COPD subjects. The expression level was normalized to GAPDH control. Data are expressed as mean ± SEM. (G) ELISA of IFN-γ level in the plasma of COPD patients and non-COPD subjects. Data are expressed as mean ± SEM. *P<0.05 vs non-COPD. The correlation was determined by Spearman’s correlation analysis, and the statistical significance of differences observed was determined by Mann–Whitney test.
Abbreviations: GAPDH, glyceraldehyde-3-phosphate dehydrogenase; GLP-1R, glucagon-like peptide-1 receptor; IFN, interferon; PBMC, peripheral blood mononuclear cell; qRT-PCR, quantitative real-time PCR; SEM, standard error of the mean.
Figure 3 GLP-1R expression of PBMCs after LIR treatment.
Notes: (A) mRNA level analyzed by qRT-PCR; relative GLP-1R mRNA level is given as the ratio between the expression level before and after LIR treatment. Data are expressed as mean ± SEM (n=12). (B, C) Representative Western blot analysis for GLP-1R protein and the average quantification obtained by densitometric analysis of the samples before and after LIR treatment in COPD patients and non-COPD subjects. Data are expressed as mean ± SEM. **P<0.01 vs control. The statistical significance of differences observed was determined by Wilcoxon matched-pairs signed-rank test.
Abbreviations: con, control; GAPDH, glyceraldehyde-3-phosphate dehydrogenase; GLP-1R, glucagon-like peptide-1 receptor; LIR, liraglutide; PBMC, peripheral blood mononuclear cell; qRT-PCR, quantitative real-time PCR; SEM, standard error of the mean.
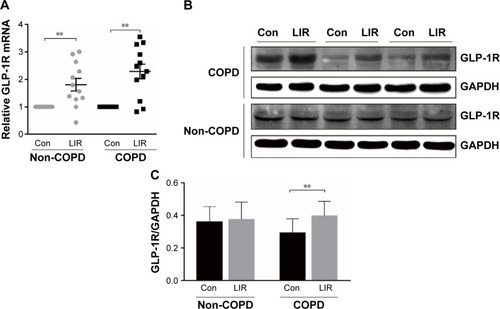
Figure 4 IFN-γ production of PBMCs stimulated by PHA in COPD patients.
Notes: (A) ELISA of PHA-stimulated IFN-γ level in the culture supernatants with or without LIR treatment overnight on PBMCs from COPD patients. Data are expressed as mean ± SEM (n=12). *P<0.05 vs PHA-stimulated group. The statistical significance of differences observed was determined by Wilcoxon matched-pairs signed-rank test. (B) ELISA of IFN-γ level in the culture supernatants from PHA-stimulated proliferation assay in both COPD patients and non-COPD subjects. Data are expressed as mean ± SEM (n=12). *P<0.05 vs non-COPD subjects. The statistical significance of differences observed was determined by Mann–Whitney test.
Abbreviations: con, control; IFN, interferon; LIR, liraglutide; N.D., not detectable; PBMC, peripheral blood mononuclear cell; PHA, phytohemagglutinin; SEM, standard error of the mean.
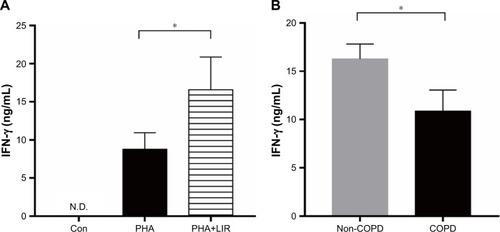
Figure 5 PD-1 expression of T cells in COPD patients.
Abbreviations: con, control; LIR, liraglutide; PD-1, programmed cell death protein 1; SEM, standard error of the mean.
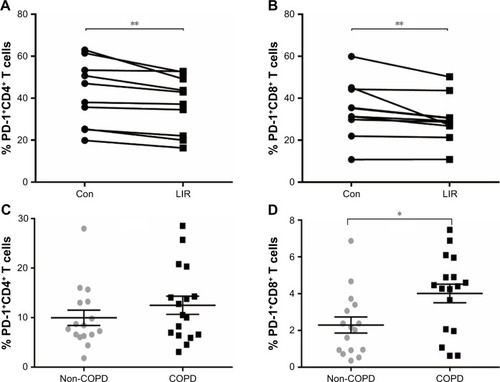
Figure S1 GLP-1R and PD-1 expression in PBMCs of COPD patients based on ICS use.
Notes: (A) qRT-PCR analysis of GLP-1R mRNA expression in PBMCs of COPD patients based on ICS use. Data are expressed as mean ± SEM. (B) Frequency of CD4+ PD-1+ T cells and (C) frequency of CD8+ PD-1+ T cells in COPD patients based on ICS use. Data are expressed as mean ± SEM. ICS, COPD patients using ICS as a current maintenance drug for at least 3 months; no ICS, COPD patients using no ICS as a current maintenance drug during the past 3 months.
Abbreviations: GLP-1R, glucagon-like peptide-1 receptor; ICS, inhaled corticosteroid; PBMC, peripheral blood mononuclear cell; PD-1, programmed cell death protein 1; qRT-PCR, quantitative real-time PCR; SEM, standard error of the mean.
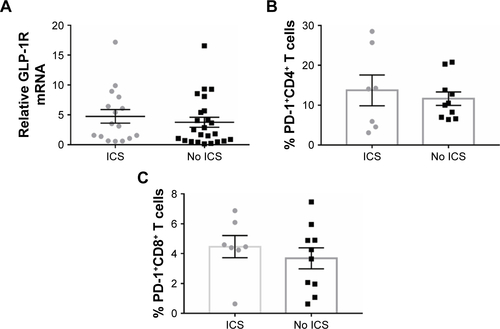
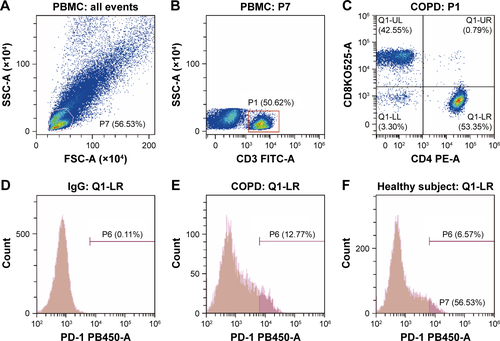
Figure S2 Flow cytometry gating strategy for PD-1+ T cells in PBMCs.
Notes: (A–C) The gating method of FACS. Initial lymphocyte populations were gated through SSC vs FSC. (B, C) Through the CD3-FITC staining and CD8-BV521 vs CD4-PE plot, lymphocytes were further identified as CD3+ CD4+ and CD3+ CD8+ population. The Q1-LR section represents the CD3+ CD4+ population and the Q1-UL section represents the CD3+ CD8+ population. (D, G) Isotype control of PD-1 expression on CD3+ CD4+ and CD3+ CD8+ lymphocytes. (D) The section of P6 is the final result of PD-1 expression on CD3+ CD4+ and (G) the section of P5 is the final result on CD3+ CD8+ lymphocytes from COPD patients (E, H) and non-COPD subjects (F, I). Isotype control is set before each independent experiment.
Abbreviations: FACS, fluorescence-activated cell sorter; FSC, forward scatter; PBMCs, peripheral blood mononuclear cells; PD-1, programmed cell death protein; SSC, side scatter.