Figures & data
Table 1 Clinical information and general data of included patients (80 cases)
Table 2 Relationship between clinical parameters and the level of HIF-1α in serum of stable COPD patients (n=80)
Figure 1 Relationship between the clinical parameters and serum level of HIF-1α in stable COPD patients.
Abbreviations: HIF-1α, hypoxia-inducible factor 1 alpha; GOLD, Global Initiative for Chronic Obstructive Lung Disease; mMRC, modified British Medical Research Council.
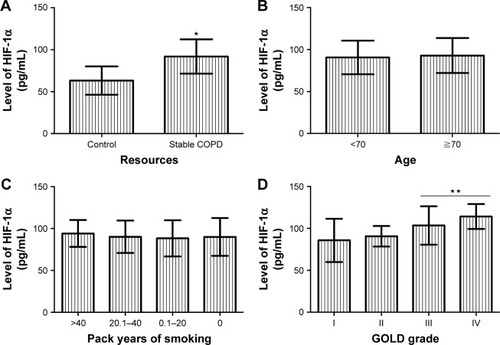
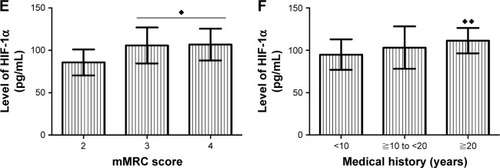
Table 3 Relationship between the clinical parameters and the serum level of IL-19 in stable COPD patients (n=80)
Figure 2 Relationship between the clinical parameters and serum level of IL-19 in serum of stable COPD patients.
Abbreviations: GOLD, Global Initiative for Chronic Obstructive Lung Disease; mMRC, modified British Medical Research Council.
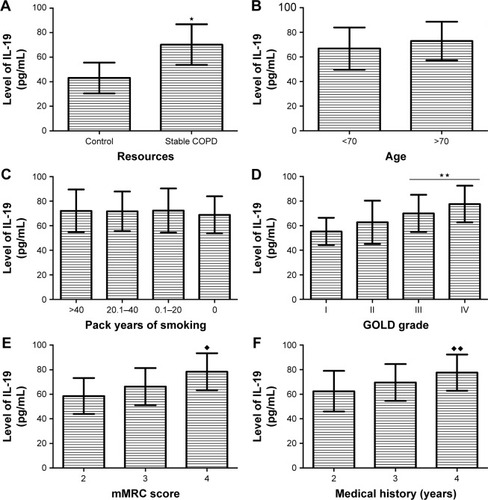
Table 4 Correlation analysis of important observed values (n=80)
Figure 3 Relationship between serum levels of HIF-1α and IL-19 in stable COPD patients.
Abbreviations: cum prob, cumulative probability; HIF-1α, hypoxia-inducible factor 1 alpha.
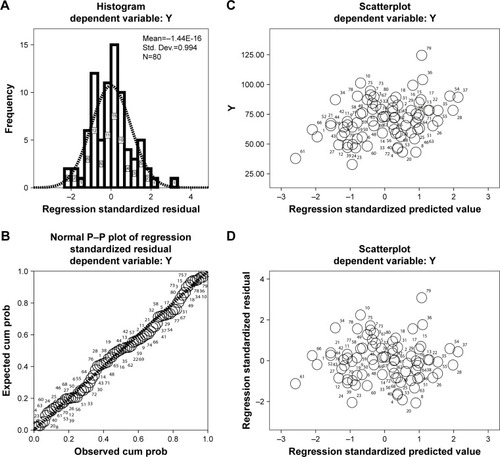
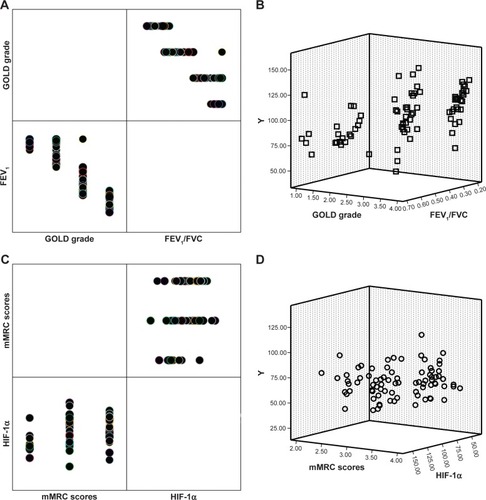
Figure 4 Relationship between serum level of HIF-1α and pulmonary function in patients with stable COPD.
Abbreviations: cum prob, cumulative probability; HIF-1α, hypoxia-inducible factor 1 alpha.
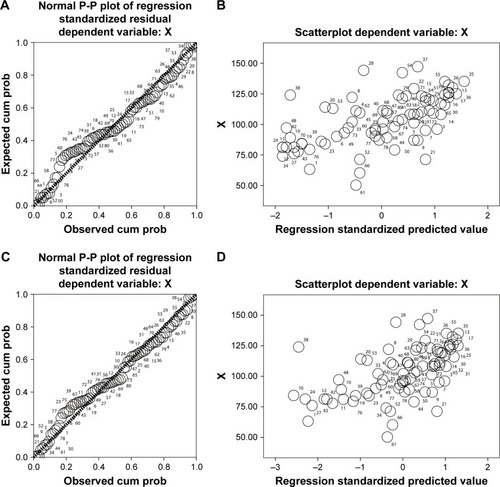
Figure 5 Relationship between the serum level of IL-19 and pulmonary function in patients with stable COPD.
Abbreviation: cum prob, cumulative probability.
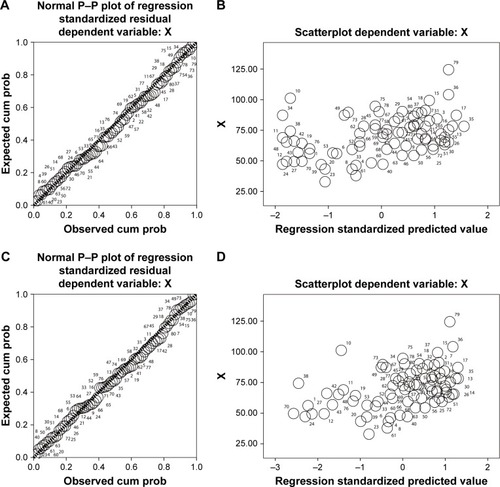
Table 5 Multiple linear regression analysis to determine the factors that affect the serum levels of HIF-1α and IL-19 (n=80)
Figure 6 The clinical factors that affect the serum levels of HIF-1α and IL-19 in stable COPD.
Abbreviations: GOLD, Global Initiative for Chronic Obstructive Lung Disease; HIF-1α, hypoxia-inducible factor 1 alpha; mMRC, modified British Medical Research Council.