Figures & data
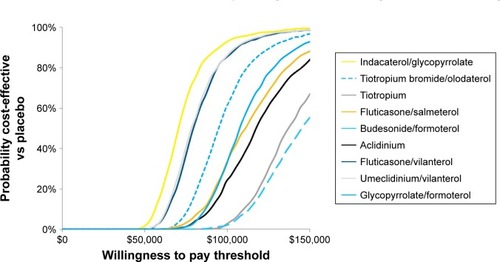
Figure 1 Model structure.
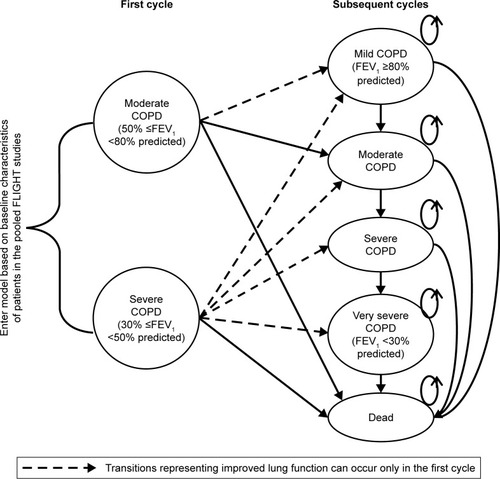
Table 1 Population and health-state inputs
Table 2 Comparator-specific inputs
Table 3 LY and QALY resultsTable Footnotea
Table 4 COPD-specific resultsTable Footnotea
Figure 2 OWSA tornado chart for cost per QALY gained for IND/GLY 27.5/15.6 µg vs placebo.a
Notes: aChart limited to the top 20 most influential parameters. All costs are presented in USD (2017).
Abbreviations: GLY, glycopyrrolate; IND, indacaterol; OWSA, one-way sensitivity analysis; QALY, quality-adjusted life year; WAC, wholesale acquisition cost.
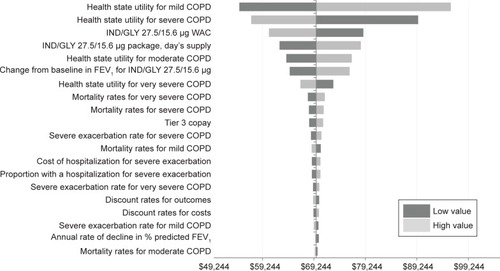
Figure 3 Cost-effectiveness acceptability curve.
Note: All costs are presented in USD (2017).