
Figures & data
Table 1 Baseline characteristics of study population
Figure 1 Patient selection flow.

Table 2 Comparison of patients’ distribution between GOLD 2007, GOLD 2013, and GOLD 2017
Figure 2 Changes in distribution of COPD patients with new GOLD 2017 classification.
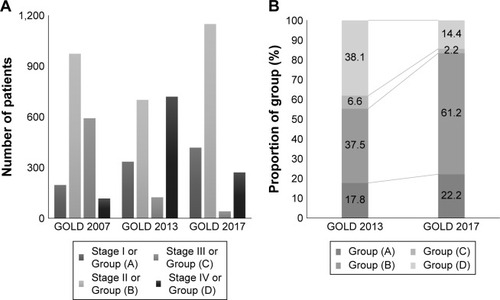
Table 3 Comparison of baseline clinical characteristics between patients in group B of GOLD 2013 and patients newly migrated to group B by GOLD 2017 classification
Table 4 Comparison of group shifting among GOLD classification systems in 1-year follow-up
Table 5 Univariate and multivariate analyses for impact of GOLD classifications on the risk of AECOPD in 1-year follow-up period
Figure 3 Associations between GOLD classifications and prospective total moderate-to-severe annual exacerbation rate.
Abbreviation: IRR, incidence rate ratio.
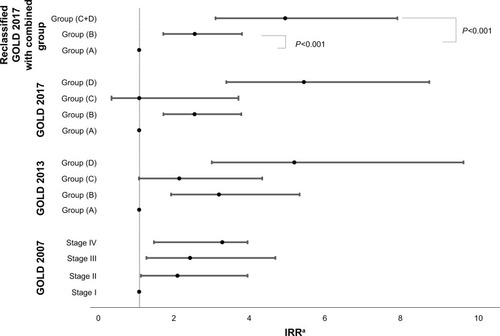
Table 6 Associations between GOLD classifications and symptomatic score (SGRQ and CAT) changesTable Footnotea in 1-year follow-up
Table 7 Associations between GOLD classifications and prospective total moderate-to-severe annual exacerbation rate
Figure S1 Changes in COPD classifications.
Abbreviations: CAT, COPD Assessment Test; GOLD, global initiative for chronic obstructive lung disease.
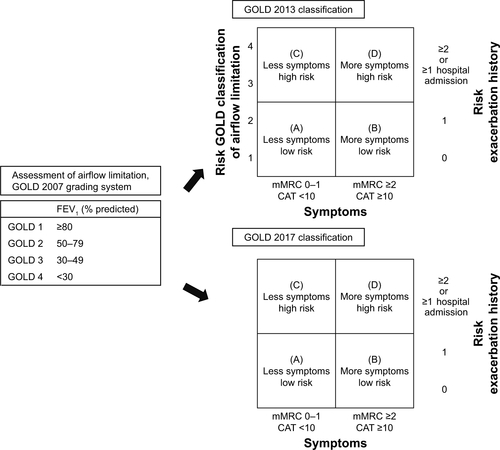
Table S1 Comparison of demographical and clinical characteristics between Class A in GOLD 2013 and 2017
Table S2 Comparison of group shifting among GOLD classification systems in 1-year follow-up
Table S3 Comparison of patients’ distribution between GOLD 2007, GOLD 2013, and GOLD 2017