
Figures & data
Table 1 Characteristics of included articles and population
Figure 1 Flowchart of the systematic review.
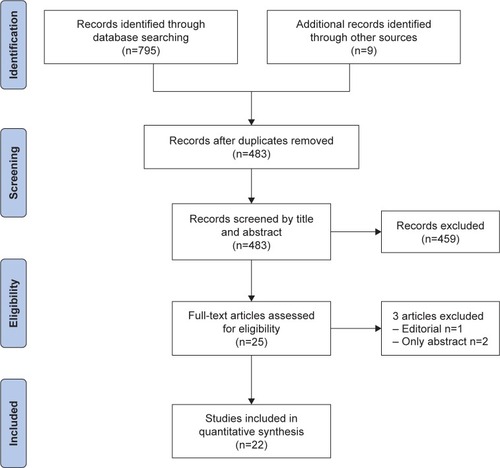
Table 2 Study quality assessment using the Newcastle-Ottawa scale
Table 3 NLR value of healthy controls, and stable and exacerbated COPD patients
Figure 2 Neutrophil-to-lymphocyte ratio in healthy controls, and stable and exacerbated COPD patients.
Note: Box plots represent median, interquartile range, and range with outliers plotted separately.
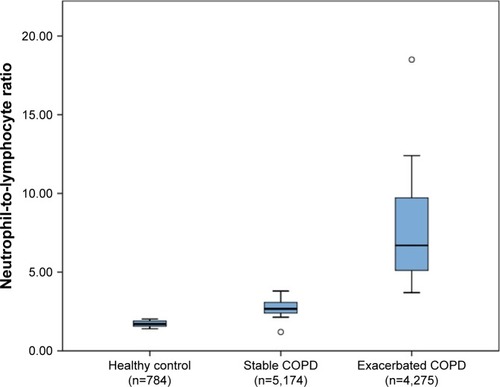
Table 4 Accuracy data of NLR for detecting COPD global and bacterial infection exacerbation
Table 5 Correlation data between NLR and FEV1
Table 6 NLR during stable and exacerbation periods according to GOLD stage
Table 7 Correlation between NLR and other inflammatory parameters in COPD patients
Table 8 Predictive value of NLR in COPD patients’ mortality based on multivariate analysis