
Figures & data
Table 1 Patient characteristics
Figure 1 Example of continuous measurements of MLD and Ai in the dependent lung field.
Abbreviations: Ai, luminal area; MLD, mean lung density.
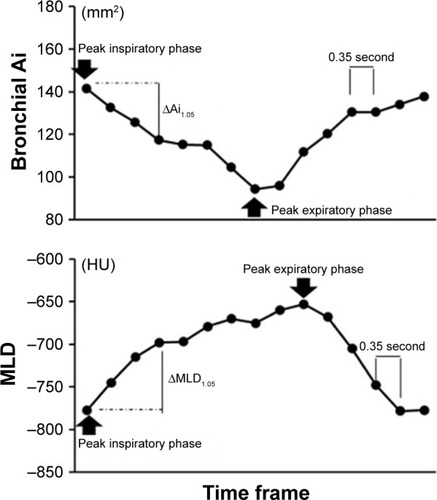
Figure 2 Example image of continuous airway measurement using the “4D Airways Analysis” software.
Abbreviation: Ai, luminal area.
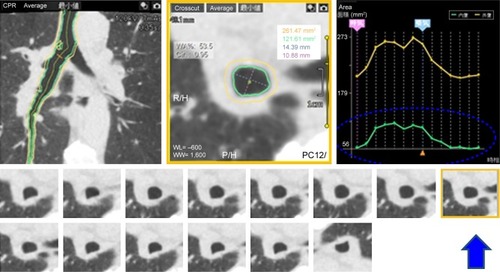
Table 2 Lung density measurements and correlations to clinical indices
Table 3 Airway dimension measurements and correlations to clinical indices
Figure 3 Measurements of cross-correlation coefficients between the two time curves from the MLD and the airway Ai in the dependent lung (A) and nondependent lung (B) of a male smoker without COPD (FEV1/FVC=0.70).
Notes: The two time curves of the MLD and the main bronchial Ai movement in the right dependent lung are in almost opposite directions, suggesting that the tracheal dilation and the lung inflation occurred simultaneously. The cross-correlation coefficient between the two time curves was large and negative (−0.84) (A). The two time curves of the MLD and the main bronchial Ai movement in the left nondependent lung moved independently of each other (cross-correlation coefficient=−0.14) (B). Change in the main bronchial Ai in the left nondependent lung (B) was much smaller than that in the right dependent lung (A). The nondependent/dependent ratio in the ΔMLD1.05 value was 0.264.
Abbreviations: Ai, luminal area; MLD, mean lung density; HU, Hounsfield unit.
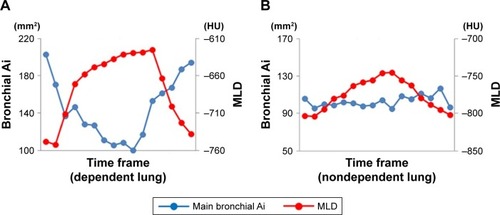
Figure 4 Measurements of cross-correlation coefficients between the two time curves from the MLD and the airway Ai in the dependent lung (A) and nondependent lung (B) of a male smoker with COPD (FEV1/FVC=0.544).
Abbreviations: Ai, luminal area; MLD, mean lung density; HU, Hounsfield unit.
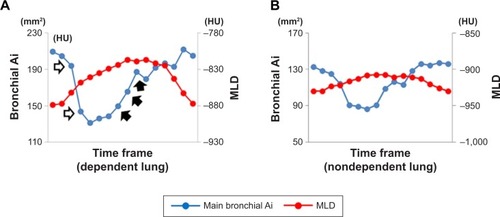
Table 4 CCCs (between main bronchial Ai and MLD) and correlations to clinical indices
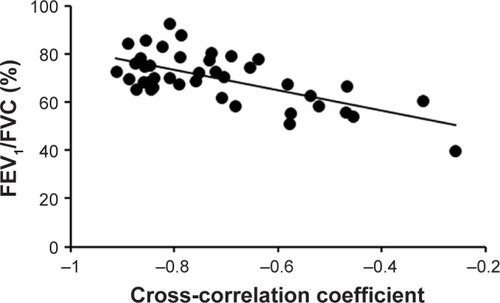
Figure 5 Scatter plots of the cross-correlation coefficient between two time curves of MLD and the main bronchial Ai movement in the dependent lung for the total study population (n=42) with FEV1/FVC.
Video S1 The dynamic-ventilation computed tomography of a non-COPD smoker. It is clear that the dependent (downside) right lung mainly respires, comparing with the nondependent (upside) left lung.
Video S2 The dynamic-ventilation computed tomography of a COPD patient. The dependent (downside) right lung and nondependent (upside) left lung move similarly, suggesting that the nondependent lung respires largely comparing with the non-COPD smoker in Video 1.