
Figures & data
Table 1 Baseline characteristics of the patients of each cohort
Figure 1 Flow diagram illustrating patient enrollment.
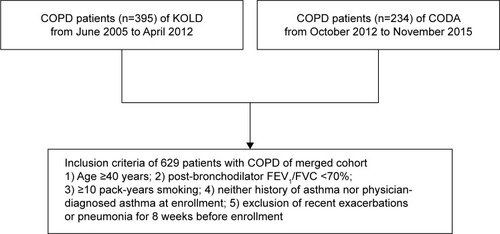
Table 2 Baseline characteristics of the patients with COPD according to blood eosinophil count
Table 3 Physiological and radiological findings of patients with COPD according to blood eosinophil count
Table 4 Factors associated with blood eosinophil count according to linear regression method
Figure 2 Survival analysis in the high eosinophil group (mean survival =9.52±0.23 years), middle group (mean survival =8.47±1.94 years), and low group (mean survival =7.42±0.27 years) (P<0.001) by using the Kaplan–Meier method.
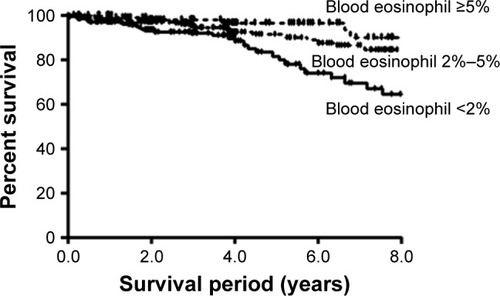
Table 5 Prognostic factors for mortality in the total COPD group according to multivariate Cox regression analysis