
Figures & data
Figure 1 Flow diagram of studies identified, included, and excluded.
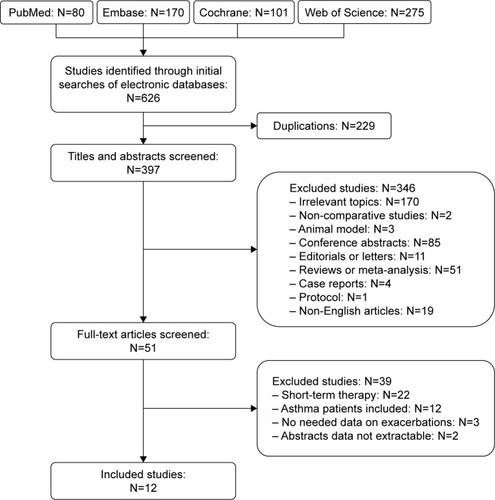
Table 1 Characteristics of included studies
Table 2 Risk of bias in the retrospective study
Figure 2 Graph of the bias risk of the enrolled RCTs.
Abbreviation: RCT, randomized controlled trail.
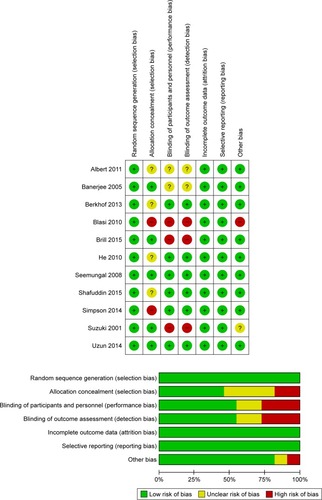
Figure 3 Forest plot and meta-analysis of the total number of patients with one or more exacerbations treated with macrolides compared with the control.
Abbreviation: M–H, Mantel–Haenszel method.
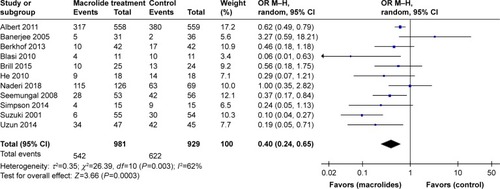
Figure 4 Forest plot and subgroup analyses of the total number of patients with one or more exacerbations treated with macrolides compared with the control: (A) different types of macrolides and (B) different durations of treatment.

Figure 5 Forest plot and meta-analysis of risk ratios for exacerbations per patient per year treated with macrolides compared with the control.
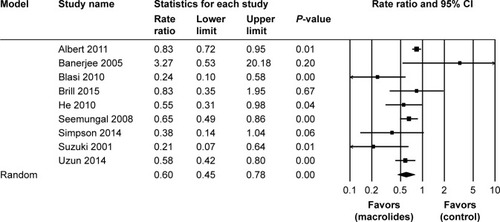
Figure 6 Forest plot and meta-analysis of the total number of patients requiring hospitalization treated with macrolides compared with the control.
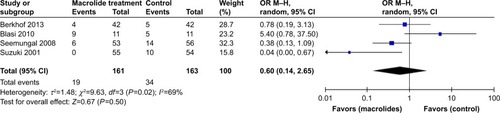
Figure 7 Forest plot and meta-analysis of the mean differences in change in total SGRQ score among patients treated with macrolides compared with the control.
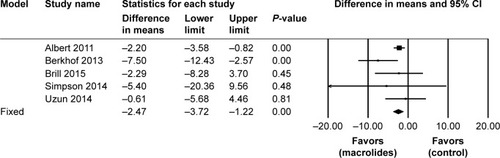
Figure 8 Forest plot and meta-analysis of the total number of patients who experienced adverse events during follow-up after treatment with macrolides compared with the control.
Abbreviation: M–H, Mantel–Haenszel method.
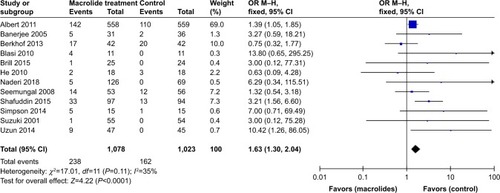
Figure 9 Forest plot and subgroup analyses of the total number of patients who experienced adverse events during follow-up after treatment with macrolides compared with the control: (A) different types of macrolides and (B) different durations of treatment.
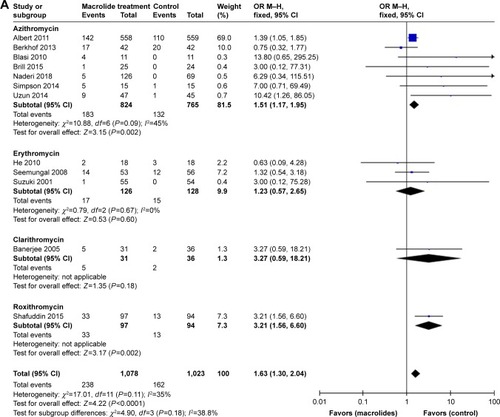
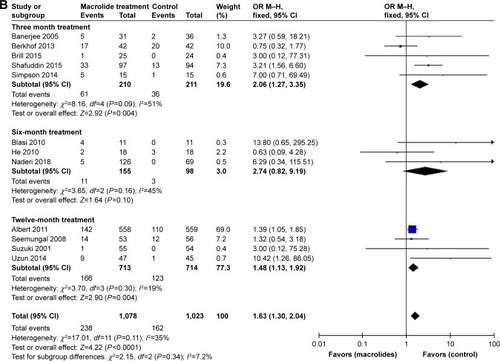
Figure 10 Funnel plots illustrating meta-analysis of the total number of patients with one or more exacerbations after treatment with macrolides compared with the control.
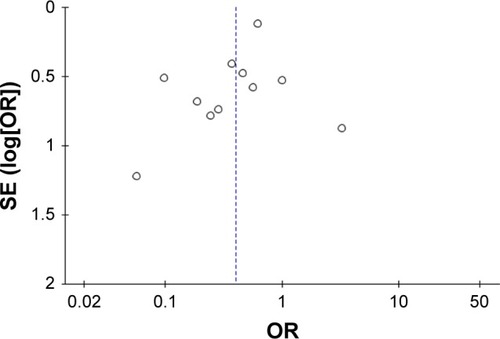
Figure S1 Sensitivity analyses of the total number of patients with one or more exacerbations treated with macrolides compared with the control.
Abbreviation: M–H, Mantel–Haenszel method.
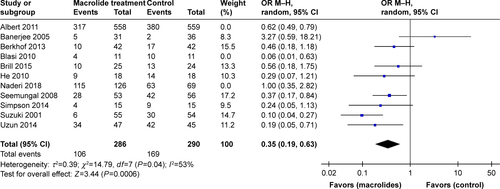
Figure S2 Sensitivity analyses of risk ratios for exacerbations per patient per year treated with macrolides compared with the control.
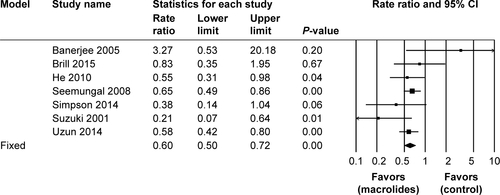
Figure S3 Sensitivity analyses of the total number of patients requiring hospitalization treated with macrolides compared with the control.
Abbreviation: M–H, Mantel–Haenszel method.

Figure S4 Sensitivity analyses of the mean differences with respect to change in total SGRQ score among patients treated with macrolides compared with the control.
Abbreviation: SGRQ, St George Respiratory Questionnaire.
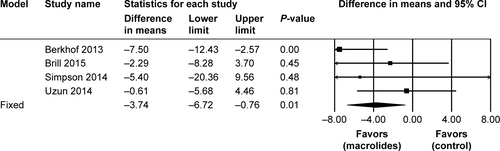
Figure S5 Sensitivity analyses of the total number of patients who experienced adverse events during follow-up after treatment with macrolides compared with the control.
Abbreviation: M–H, Mantel–Haenszel method.
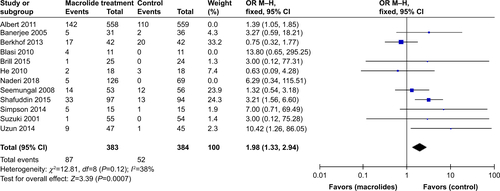
Table S1 Sensitivity analyses of subgroup based on the number of patients with exacerbations and adverse effects