
Figures & data
Table 1 Characteristics of all the participants in the SDBT and FDBT groups
Figure 1 Pulmonary function test: FVC (A), FEV1 (B and C), FEV1/FVC (D), and PImax (E) between the SDBT (n=15) and FDBT (n=15) in the pre-experimental period (white bar) and post-experimental period (black bar).
Notes: P-value was analyzed statistically using the post hoc Bonferroni test. Each bar represents the mean and SD.
Abbreviations: PImax, maximal inspiratory pressure; SDBT, slow deep-breathing technique; FDBT, fast deep-breathing technique.
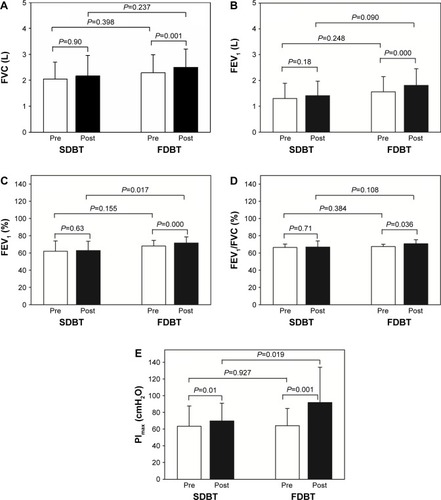
Figure 2 Levels of TAC (A), MDA (B), NO (C), TNF-α (D), and IL-6 (E) for the SDBT (n=15) and FDBT (n=15) groups in the pre-experimental period (white bar) and post-experimental period (black bar).
Notes: P-value was analyzed statistically using the post hoc Bonferroni test. Each bar represents the mean and SD.
Abbreviations: TAC, total antioxidant capacity; MDA, malondialdehyde; NO, nitric oxide; TNF-α, tumor necrosis factor-alpha; SDBT, slow deep-breathing technique; FDBT, fast deep-breathing technique.
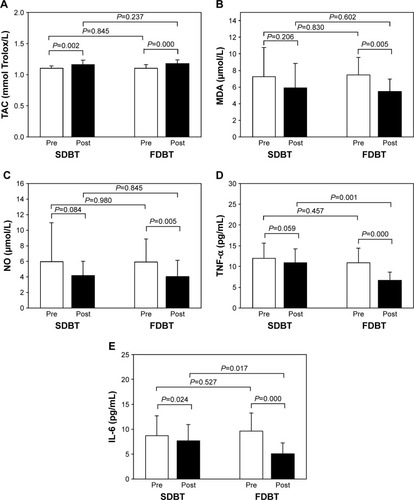
Figure 3 6MWD (A) and total QoL score (B) between the SDBT (n=15) and FDBT (n=15) groups in the pre-experimental period (white bar) and post-experimental period (black bar).
Abbreviations: 6MWD, 6-minute walking distance; QoL, quality of life; SDBT, slow deep-breathing technique; FDBT, fast deep-breathing technique.
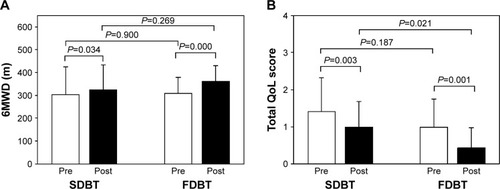
Table 2 Pulmonary function test and respiratory muscle strength in both groups before and after training
Table 3 Oxidative stress markers (TAC, GSH, MDA, and NO) and cytokine markers (TNF-α and IL-6) in both groups before and after the experimental period
Table 4 6MWD and QoL in both groups before and after the experimental period