Figures & data
Figure 1 Flow diagram of the user database and study users.
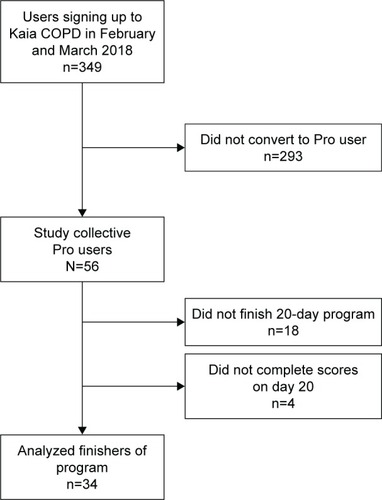
Table 1 List of contraindications as mentioned in the app
Figure 2 Screenshots of the Kaia COPD App.

Table 2 Demographic properties of all included patients and those who finished the 20-day program and completed the follow-up questionnaire
Figure 3 The box-plot shows CAT scores in patients finishing the program at baseline and after completion of the 20-day program.
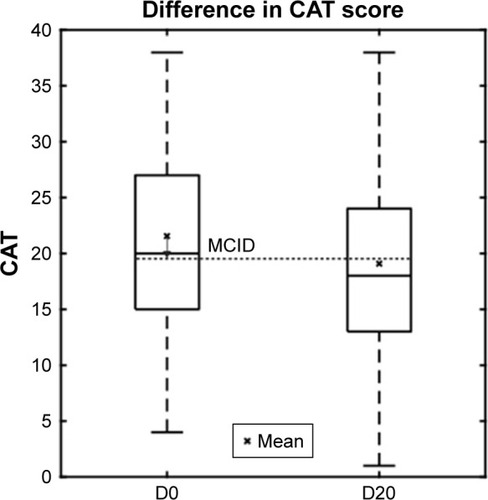
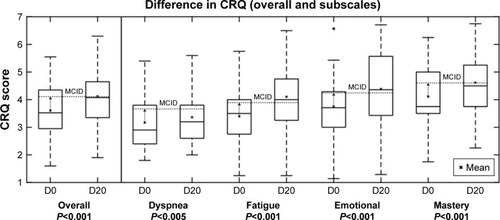
Figure 4 The box-plot shows CRQ scores in patients finishing the program at baseline (D0) and after completion (D20) of the 20-day program in the four domains: dyspnea, fatigue, emotional function, and mastery. Mean are shown with an x and the minimum clinically important difference for the CRQ score (0.5 change from baseline) is depicted.