
Figures & data
Table 1 Overview of GOLD classification
Figure 1 Distribution of A, B, C, and D groups according to GOLD 2011, GOLD 2013, and GOLD 2017 in the study population.
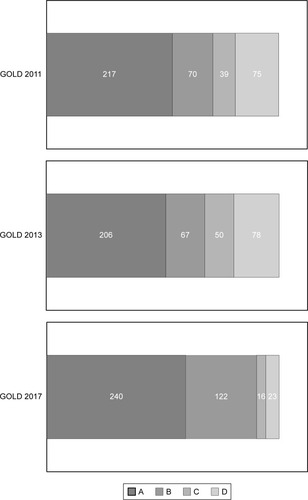
Figure 2 Distribution of GOLD stages of airflow limitation in the study population.
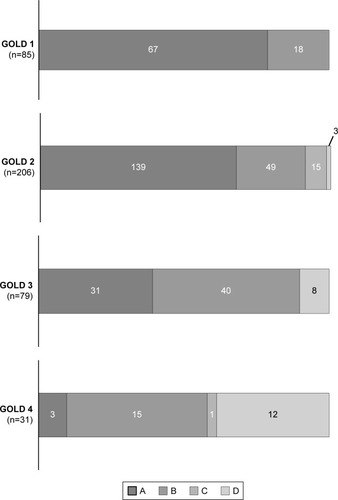
Table 2 Characteristics of the study patients at baseline according to the ABCD classification (n=401)
Table 3 Comparison of the clinical phenotype of less symptomatic patients (groups A and C) with that of more symptomatic patients (groups B and D)
Table 4 Comparison of the clinical phenotype of patients at low risk (groups A and B) with that of patients at high risk (groups C and D)
Table 5 ORs of all exacerbations, exacerbations leading to hospital admission, and all-cause mortality according to the ABCD classification
Table 6 Comparison of exacerbations and mortality between low-risk patients (groups A and B) and high-risk patients (groups C and D)