Figures & data
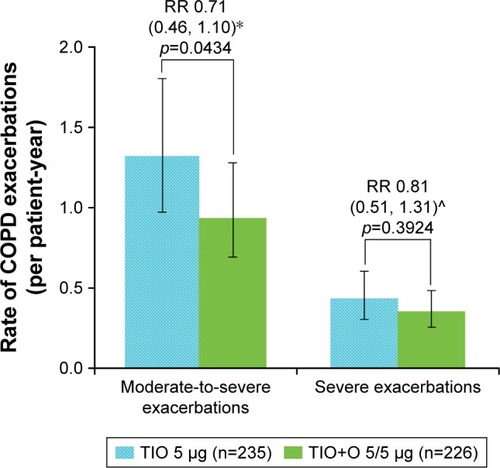
Figure 3 Annualized rate of COPD exacerbations by treatment group.
Notes: Error bars represent the 99% CI for rate of moderate-to-severe COPD exacerbations and the 95% CI for rate of severe COPD exacerbations. Listed values are RR (CI: *99% CI; ^95% CI), p-value. Negative binominal model, adjusted for treatment exposure. The duration of an event is not included in the calculation of a patient’s exposure.
Abbreviations: OLO, olodaterol; TIO, tiotropium; RR, rate ratio.
Abbreviations: OLO, olodaterol; TIO, tiotropium; RR, rate ratio.