Figures & data
Figure 1 Bodyweight and performance aerobic analysis at baseline, 8, 16, and 24 weeks. Data are mean ± standard deviation. (A–C) represents body weight gain, time running, and speed. Statistically significant differences compared to: aControl; cSmoke. p < 0.05.
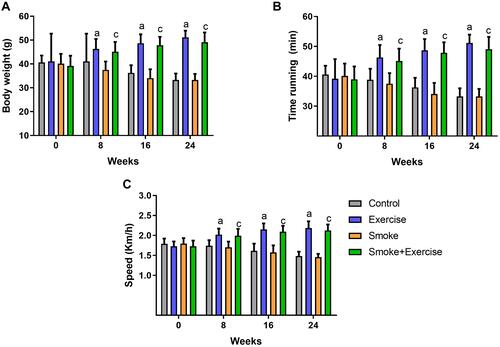
Figure 2 Histological sections of the quadriceps muscle with hematoxylin–eosin (HE) staining (Scale bars, 50 μm). Data are mean ± standard deviation (A–D) represents a board of histological slides, quadriceps muscle cross-sectional area, and frequency. Statistically significant differences compared to: aControl; bExercise. p < 0.05.
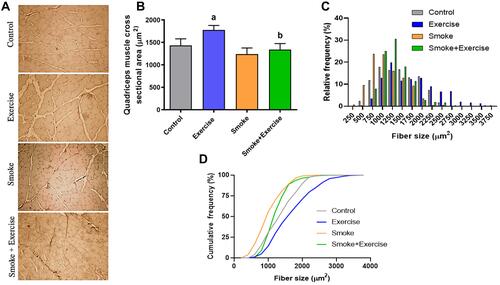
Figure 3 MMP-2 activity in arbitrary units in the quadriceps muscle. Data are mean ± standard deviation. (A–C) represents optical densitometry of zymographic bands, Pro MMP-2 (~64 kDa), and active MMP-2 activity (~62 kDa). Statistically significant differences compared to aControl; cSmoke. p < 0.05.
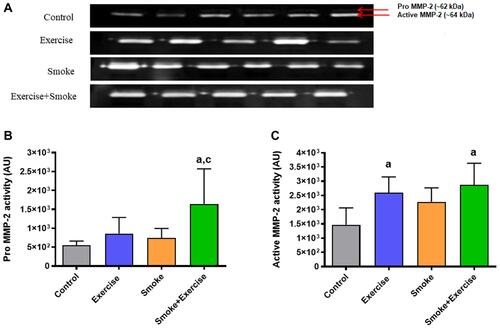
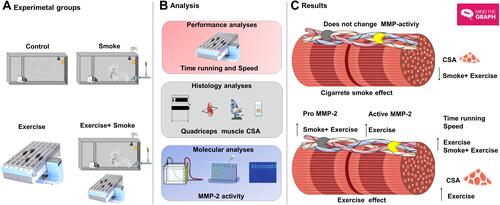
Figure 4 Overview of quadriceps muscle remodeling exposed to smoke and aerobic exercise training. (A–C) represents experimental groups, analysis, and main results. Moderate treadmill training for 24 weeks in mice exposed to cigarette smoke did not promote CSA gain, despite inducing higher pro-MMP-2 activity in quadriceps muscle mass. The figure was created in the Servier Medical Art (www.smart.servier.com) licensed under a Creative Commons Attribution 3.0 Unported (free) and Mind the Graph platform (www.mindthegraph.com) licensed under the Attribution-Share Alike 4.0 International license.