Figures & data
Table 1 Characteristics of COPD Subjects and Non-COPD Controls
Table 2 Factors Correlated with Serum C1q in COPD Subjects
Figure 1 Serum C1q showed a downward trend in COPD subjects (A), especially in GOLD 3–4 (B) and severe emphysema (C). Serum C1q was obviously positively correlated with the FEV1/FVC ratio and predicted FEV1% in COPD (D and E) but had a weakly negative correlation with the %LAA-950 (F). *P < 0.05, **P < 0.01, ***P < 0.001.
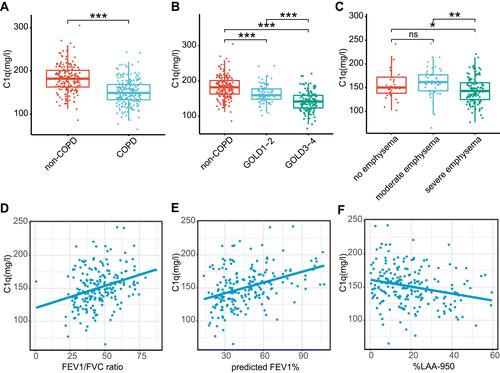
Figure 2 Serum C1q decreased in AECOPD subjects compared with stable COPD and non-COPD (A). Serum C1q was weakly negatively correlated with the percentage of neutrophils in peripheral blood in COPD subjects (B). ***P < 0.001.
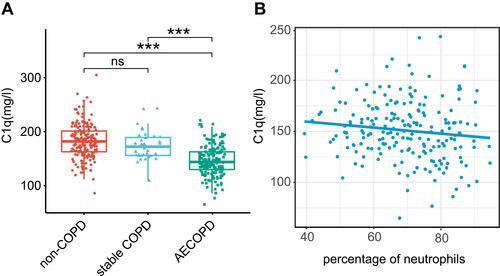
Table 3 Differences in the COPD Subjects Outcomes During 1-Year Follow-Up According to the Levels of Serum C1q on Admission
Figure 3 Serum C1q levels were downregulated in 44 follow-up severe exacerbators (A). Diagnostic accuracy of serum C1q to differentiate severe exacerbations in 144 follow-up COPD subjects (B). Area under the curves (AUC) was 0.762, and the cutoff value was set to 137.150 mg/L. Differences between subjects with low and high C1q levels in time to the next severe exacerbation (C) and time to death (D). ***P < 0.001.
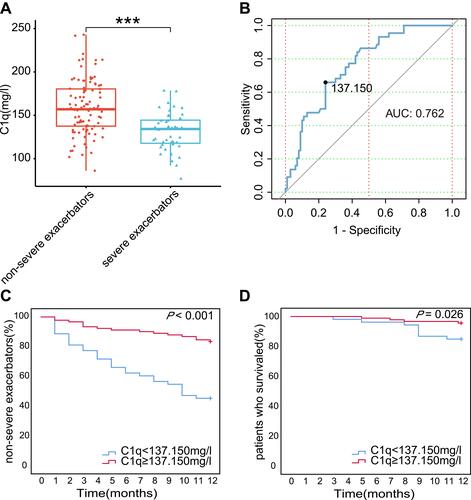
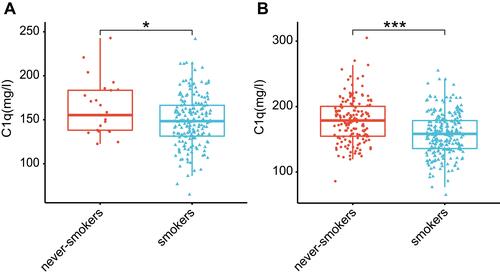
Figure 4 C1q levels of smokers were lower than those of never-smokers, whether in COPD subjects (A) or all 394 subjects (B). *P < 0.05, ***P < 0.001.