Figures & data
Table 1 Clinical and Lung Physiology Characteristics in Patients Stratified According to Sputum Eosinophils Count
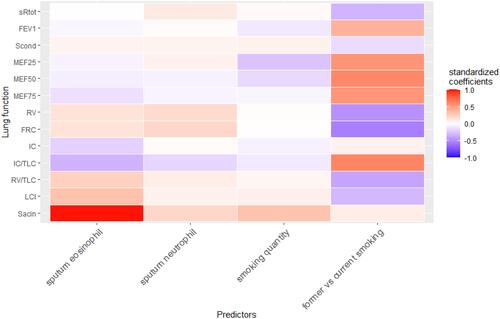
Figure 1 Predictors of lung function in early COPD: a heatmap illustrating the power of predictors (x-axis) expressed as standardized estimates (coefficient) from linear multivariate regressions for lung function measures (y-axis). Colors indicate the positive (red) and negative (violet) impact of the predictor on each lung function measure.
Abbreviations: FEV1, forced expiratory volume in 1 second; MEF, maximal expiratory flow at 25% (MEF50), 50% (MEF50) and 75% (MEF75) of forced vital capacity; FRC, functional residual capacity; RV, residual volume; TLC, total lung capacity; sRtot, total specific airway resistance; IC, inspiratory capacity; LCI, lung clearance index; Sacin and Scond, acinar and conductive ventilation inhomogeneity.