Figures & data
Figure 1 Long-term CS exposure led to emphysema and skeletal muscle dysfunction. (A–F) Airway resistance (RL), lung compliance, FVC, FEV0.1, FEV0.1/FVC, and FEF25-75% were measured in mice; (G) H&E staining of lung tissues from mice exposed to air and CS; Arrows (left) indicate destruction of the alveolar wall; Arrow (right) indicate Inflammatory cells infiltrates in the lung parenchyma and interstitial spaces; The scale in each image is 100 μm; (H and I) histogram of MLI and DI; (J) FACS showed the neutrophils (CD11B+Ly6G+) and eosinophils (CD11B+SiglecF+) in BALF; (K) histogram of grip strength; (L) H&E staining of muscles from mice exposed to air and CS; Arrows indicate changes in muscle fibers and widening of gaps; The scale in each image is 100 μm; (M) WB showed the protein expression of Slow MyHC, Fast MyHC, MuRF1, Atrogin1 and MSTN in muscles of air and CS-exposed mice; (N) the expression of Slow MyHC in muscles from mice. n = 5, *P < 0.05, **P < 0.01, ***P < 0.001.
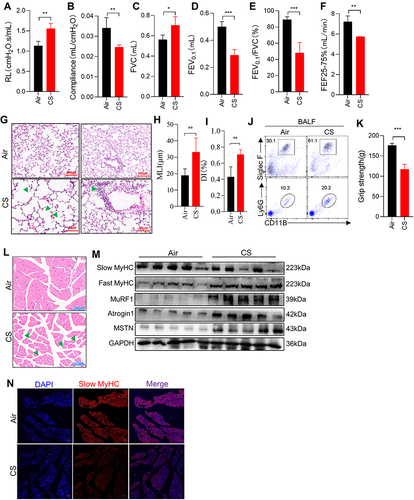
Figure 2 Chronic CS exposure caused ferroptosis in skeletal muscles from mice. (A) Cell death was enriched in skeletal muscles from COPD patients and healthy control by GSEA. (B and C) Gene expression of Gpx4 and Ncoa4 in skeletal muscles from mice by RNA-sequencing; (D) RT-qPCR examined the expression of Gpx4, Slc7a11, Tfr1, and Ncoa4 in muscles; (E) WB showed the protein expression of GPX4 in muscles; (F) IF showed the expression of GPX4 in muscles from mice exposed to air and CS; The scale in each image is 50 μm; (G) the content of GSH in muscles; (H) the level of LPO in muscles determined by colorimetry; (I) IF showed the expression of 4-HNE in muscles from mice exposed to air and CS; The scale in each image is 50 μm. n = 5, *P < 0.05, **P < 0.01, ***P < 0.001, ****P < 0.0001.
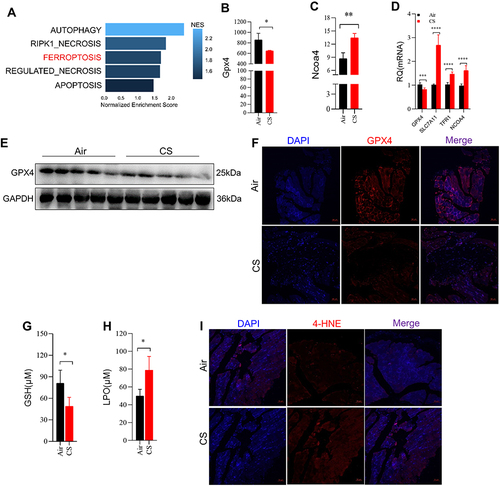
Figure 3 CSE stimulation caused ferroptosis in C2C12 myotubes. (A) Cellular morphology of C2C12 myoblasts and C2C12 myotubes. The scale in each image is 100 μm; (B) the proportion of cell death was detected by flow cytometry with 7AAD staining in Ctrl and 3% CSE-stimulated myotubes; (C) RT-qPCR examined the expression of Gpx4, Slc7a11, Slc3a2, Tfr1, Ncoa4, Acls4 and Lpcat3 in C2C12 myotubes; (D) WB showed the protein expression of GPX4, MuRF1, Atrogin1, and MSTN in C2C12 myotubes; (E) the level of Fe2+ was detected by flow cytometry with the fluorescent probe; (F) the content of GSH in C2C12 myotubes; (G) lipid ROS was detected by flow cytometry with C11 BODIPY; (H) the level of LPO in C2C12 myotubes. (I) The proportion of cell death was detected by flow cytometry with 7AAD staining. UAMC-3203, a ferroptosis inhibitor. ***P < 0.001, ****P < 0.0001.
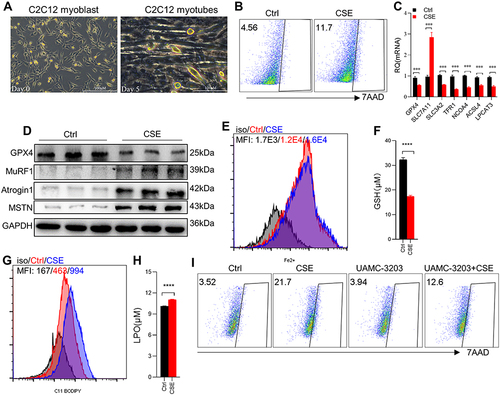
Figure 4 CSE induced ferroptosis by up-regulating the expression of MSTN. (A) WB showed the expression of GPX4 in myotubes; (B) the expression of lipid ROS in myotubes by confocal microscopy with C11 BODIPY; The scale in each image is 100 μm; (C) the proportion of cell death was detected by flow cytometry with 7AAD staining in different concentration of MSTN treated myotubes; (D) WB showed the protein expression of GPX4 and HIF2α; (E) histogram of the content of GSH in myotubes; (F and G) flow cytometry detected the levels of Fe2+ and lipid ROS in different concentration of MSTN treated myotubes; (H) histogram of the content of LPO in myotubes. *P < 0.05,**P < 0.01,****P < 0.0001.
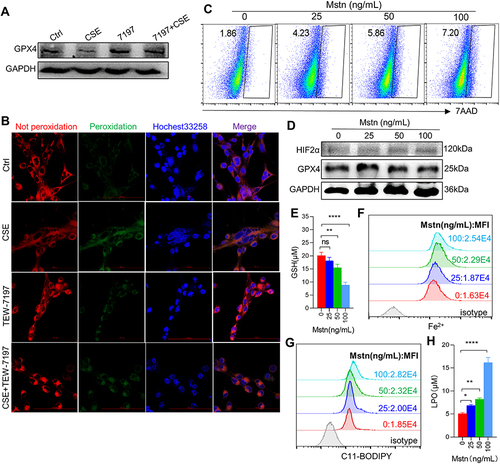
Figure 5 Ferroptosis inhibitor intervention alleviated ferroptosis-related indicators caused by MSTN. (A) Cell death was detected by flow cytometry; (B) the protein expression of GPX4; (C) Histogram of the content of GSH; (D and E) flow cytometry detected the levels of Fe2+ and lipid ROS; (F) histogram of the content of LPO; (G) the expression of lipid ROS in myotubes using confocal microscopy; The scale in each image is 100 μm. *P < 0.05,**P < 0.01,***P < 0.001, ****P < 0.0001.
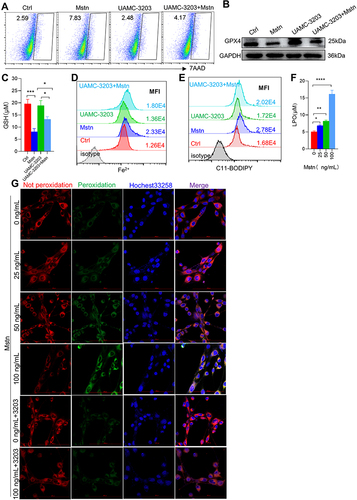
Figure 6 HIF2α inhibition alleviated ferroptosis-related indicators caused by CSE. (A) Corplot showed the correlation between Hif1α, Epas1, Hif3α, and Gpx4. (B) Gene expression of Hif1α, Epas1, and Hif3α in skeletal muscles from mice by RNA-sequencing; (C) WB showed the protein expression of HIF2α in muscles (up) and C2C12 myotubes (down); (D) the proportion of cell death was detected by flow cytometry with 7AAD staining in myotubes; (E) RT-qPCR detected the expression of Gpx4 in myotubes; (F) the expression of HIF2α and GPX4 were detected by WB; (G and H) the levels of Fe2+ and lipid ROS were detected by flow cytometry; (I and J) histogram of the content of LPO and GSH in C2C12 myotubes. HIF2α IN, an inhibitor of HIF2α. *P < 0.05,**P < 0.01,****P < 0.0001.
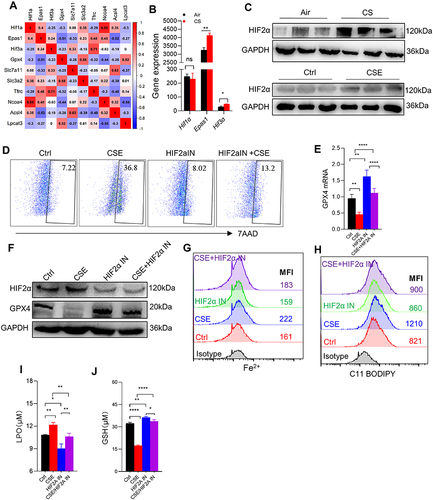
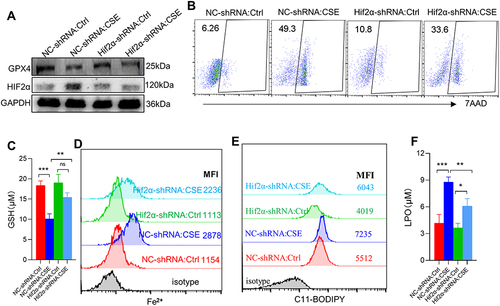
Figure 7 HIF2α knocking down alleviated ferroptosis-related indicators caused by CSE. (A) WB showed the protein expression of GPX4 and HIF2α; (B) the proportion of cell death was detected by flow cytometry with 7AAD staining in myotubes; (C) histogram of the content of GSH in myotubes; (D and E) flow cytometry detected the levels of Fe2+ and lipid ROS in myotubes; (F) histogram of the content of LPO in myotubes. *P < 0.05,**P < 0.01,***P < 0.001.