
Figures & data
Table 1 Characteristics of Study Population
Figure 1 (A and B) Expression levels of A2M and MMP-9 in plasma between stable COPD patients and healthy group by ELISA were measurement. (C) Pearson’s correlation analysis was employed to reveal the relationship between A2M and MMP9. (D) MMP-9/A2M ratio in stable COPD patients compared with the control groups. Differences between the groups were assessed by two-sample independent Student’s t-test analysis. ****P < 0.0001.
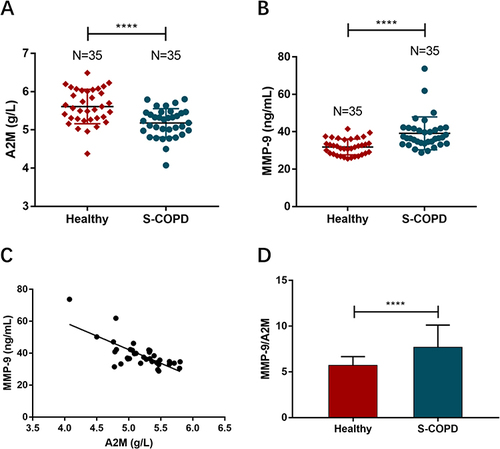
Table 2 Correlation Between A2M, MMP-9, MMP-9/A2M and Clinical and Lung Function Indexes of Stable COPD Patients
Figure 2 (A and B) Expression levels of A2M and MMP-9 between healthy nonsmoking group, healthy smoking group, COPD nonsmoking group and COPD smoking group. Differences between the groups were assessed by one-way analysis of variance. NS: no significant (P > 0.05), *P < 0.05.
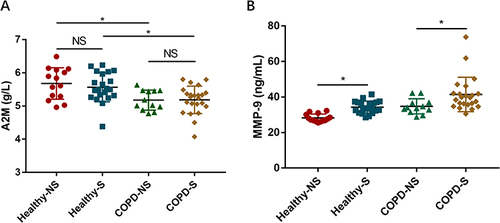
Figure 3 (A and B) Performances of A2M and MMP-9/A2M in the diagnosis of COPD.
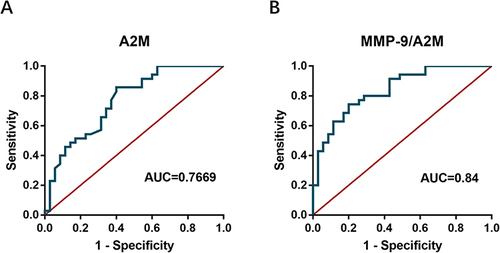
Figure 4 (A) Expression levels of MMP-9 between stable COPD group and AECOPD group. (B) Value of MMP-9 in predicting acute exacerbation of COPD. (C) Based on two-sample independent Student’s t-test analysis, expression levels of A2M between stable COPD group and AECOPD group. Differences between the groups were assessed by two-sample independent Student’s t-test analysis. NS: no significant (P > 0.05), ****P < 0.0001.
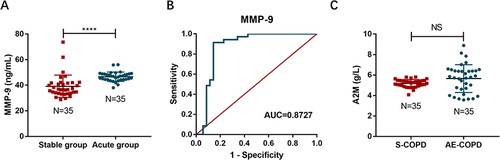
Figure 5 Expression levels of A2M between non-infection AECOPD group and infection AECOPD group. Differences between the groups were assessed by two-sample independent Student’s t-test analysis. ****P < 0.0001.
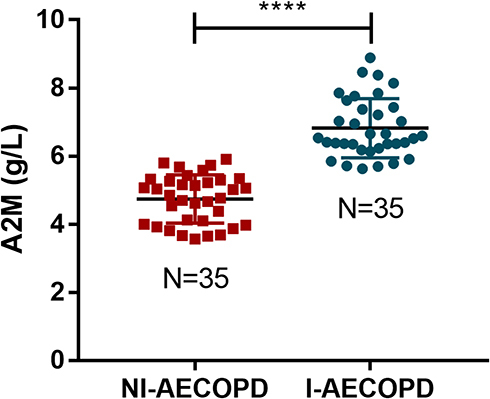
Table 3 Characteristics of AECOPD Patients (with or Without Infection)