
Figures & data
Table 1 Demographics and Clinical Characteristics of All Participants
Figure 1 Imbalance of circulating Th1 and Th2 cells in patients with chronic obstructive pulmonary disease (COPD). (A) Lymphocytes were gated on forward scatter area (FSC-A) versus side scatter area (SSC-A) plots, and CD4+ T cells were identified based on their expression of CD3, not CD8. (B) Representative flow cytometric dot plots of Th1 and Th2 cells in peripheral blood. Comparisons of Th1 (C) and Th2 (D) cell percentages in the peripheral blood from healthy controls (HC, n = 20), healthy smokers (HS, n = 18) and COPD patients (n = 22). The data are represented as the mean ± SEM; a value of P < 0.05 (2-tailed) was considered statistically significant.
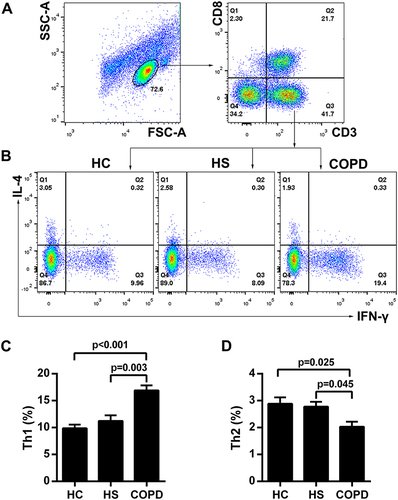
Figure 2 Disorder of pro-inflammatory cytokines in the plasma from patients with chronic obstructive pulmonary disease (COPD). Standardized sandwich ELISAs of plasma from healthy controls (HC, n = 20), healthy smokers (HS, n = 18) and COPD patients (n = 22) were performed to assess the levels of IFN-γ (A), IL-4 (B), IL-1β (C) and IL-18 (D). The data are represented as the mean ± SEM; a value of P < 0.05 (2-tailed) was considered statistically significant.
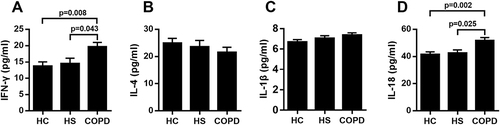
Figure 3 Correlation between plasma cytokine levels and lung function in patients with chronic obstructive pulmonary disease (COPD). Correlation of plasma IFN-γ (A), IL-4 (B), IL-1β (C) and IL-18 (D) levels with FEV1% predicted value in COPD patients (n = 22). Each symbol represents one individual COPD patient (black dots); a value of P < 0.05 (2-tailed) was considered statistically significant.
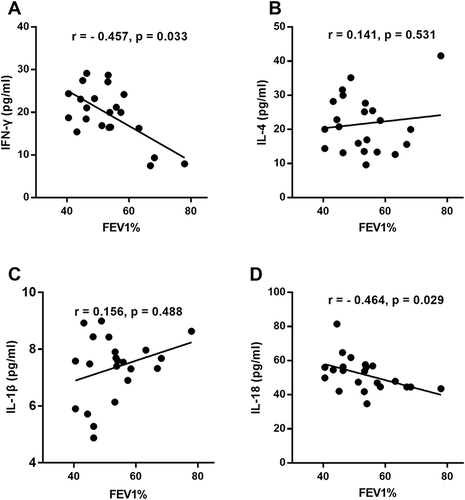
Figure 4 The effect of cigarette smoke extract (CSE) on cell viability. The cytotoxicity of CSE based on the dehydrogenase activity of viable cells was measured by CCK-8 assay at an absorbance of 450 nm. The CD4+ T cells were stimulated with serial dilutions of CSE for 5 d (n = 4). The data are represented as the mean ± SEM; *P < 0.05 vs 0% CSE.
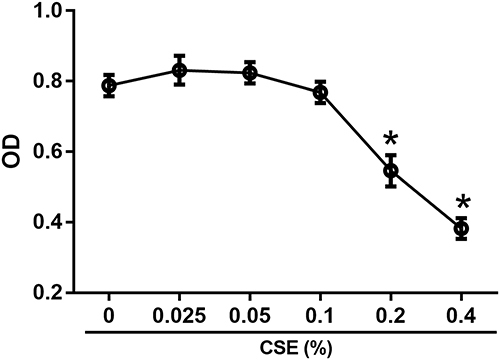
Figure 5 The contribution of IL-12 and IL-4 on cigarette smoke extract (CSE)-regulated Th1 and Th2 differentiation. The CD4+ T cells from healthy nonsmokers were stimulated with IL-2/anti-CD3/CD28 (control -conditioned) in the presence of serial concentrations of cigarette smoke extract (CSE) with and without 20 ng/mL IL-12 (Th1-conditioned) or IL-4(Th2-conditioned) for 5 d. The expression of Th1/Th2 was analyzed using flow cytometry (A and B), and NLRP3 mRNA levels were analyzed using qRT‒PCR (C) (n = 4). The data are represented as the mean ± SEM; *P<0.05 vs control-conditioned; #P<0.05 vs 0% CSE.
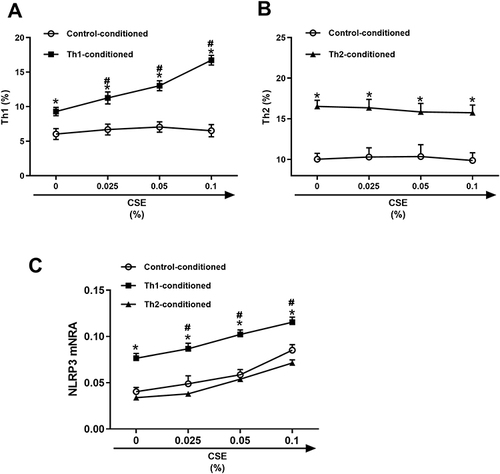
Figure 6 Alterations of α7 nAChR expression in CD4+ T cells by IL-12 and IL-4. The CD4+ T cells from healthy nonsmokers were incubated in the presence of IL-2/anti-CD3/CD28 alone or with cigarette smoke extract (CSE), IL-12 (20 ng/mL), IL-4 (20 ng/mL) or GTS-21 (an agonist for the α7 nAChR; 10 μmol/l) for 5 d, after which the levels of α7 nAChR mRNA (A and B) and Th1/Th2 differentiation (C and D) were analyzed (n = 4). The data are represented as the mean ± SEM; *P<0.05 vs Control; #P<0.05 vs anti-CD3/CD28/IL-12. ΔP<0.05 vs anti-CD3/CD28/IL-12 + CSE.
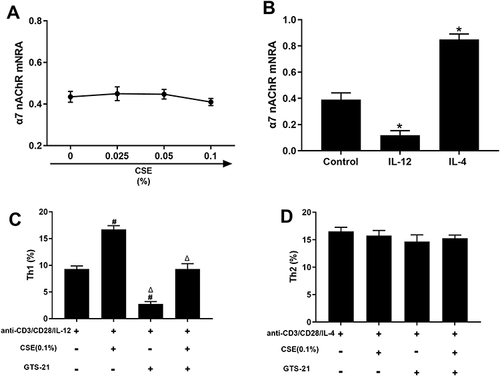
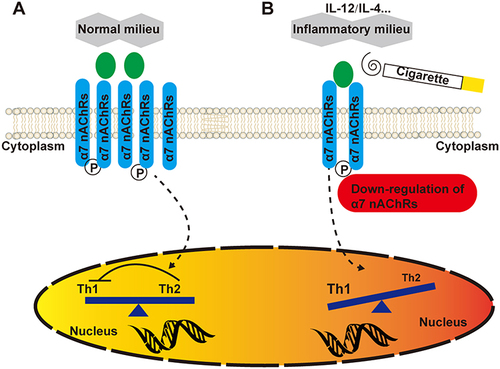
Figure 7 Schematic representation of Th1/Th2 cell dysfunction via the cytokine milieu. (A) In the presence of a normal milieu, appropriate α7 nAChR expression in CD4+ T cells keeps effector T cells in balance. (B) However, upon inflammatory insult or cigarette smoke extract (CSE) exposure, downregulation of α7 nAChRs by the activated immune system in susceptible individuals evokes Th1 cell-mediated proinflammatory responses.
Data Sharing Statement
All data generated or analyzed during this study are included in this published article.