
Figures & data
Table 1 Clinical Characteristics of Enrolled Subjects from Whom Lung Tissues Were Collected
Figure 1 Enhanced miR-21 expression in lung tissue of COPD patients. Assessment of MiR-21 via qRT-PCR across groups: Con-NS (non-smokers, no COPD) (n =5), Con-S (smokers, no COPD) (n =7), and COPD (patients with COPD) (n =7). Data represent mean ± standard deviation. Statistical thresholds: *P < 0.05, (via one-way ANOVA).
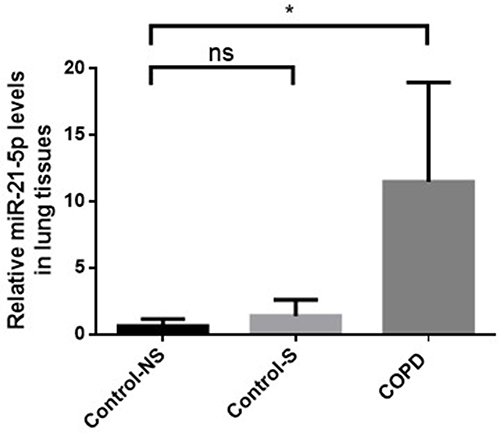
Figure 2 Decreased PTEN expression, activating Akt/NF-κB pathway, and increasing inflammation and apoptosis in COPD patients. (A) Protein levels of PTEN, phosphorylated Akt (p-Akt), Akt, phosphorylated NF-κB (p-NF-κB), NF-κB, and β-actin in Western blot analysis. (B) Comparison of PTEN, p-Akt, p-NF-κB protein levels. (C) IL-6 and (D) IL-8 levels were measured by ELISA. (E)Western blot were determined and (F) relative protein levels of cleaved caspase-3 in the peripheral lung tissue. Density of bands measured using ImageJ. β-actin for normalization. Group classification: Con-NS (non-smokers, no COPD) (n =5), Con-S (smokers, no COPD) (n =7), COPD (COPD patients) (n =7). Data: average values ± standard deviation. Statistical thresholds: *P < 0.05, **P < 0.01, via one-way ANOVA.
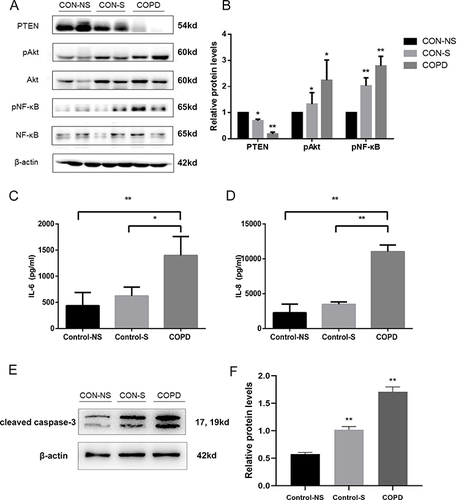
Figure 3 Increased miR-21 expression, reduced PTEN expression and following activation of Akt in lung from COPD mice. (A) Lung tissue of mice exposed to air and cigarette smoke (CS) analyzed via Hematoxylin-eosin staining, revealing tissue destruction and airway dilation (original magnification ×100). Bar: 200 μm. (B and C) Evaluation of lung architecture through Mean Linear Intercept (MLI) quantification and Emphysema assessment via Mean Alveolar Numbers (MAN). (D) Determination of miR-21 levels in lung tissue by quantitative Real-Time PCR (qRT-PCR). (E) Protein expression of PTEN, phosphorylated Akt (p-Akt), Akt, phosphorylated NF-κB (p-NF-κB), NF-κB assessed by Western Blot. (F) Band density quantified using ImageJ. Data presented as mean ± standard deviation, n = 3. Statistical analysis: *P < 0.05, **P < 0.01, via one-way ANOVA.
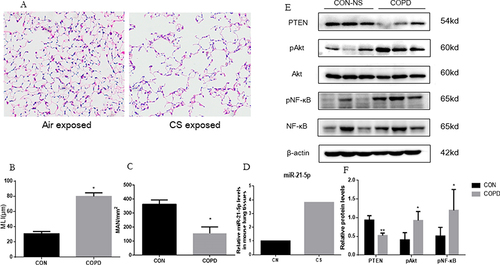
Figure 4 CSE inducing increase of miR-21 and decrease of PTEN in HBE cells. (A) Exposure of HBE cells to 5% CSE at intervals of 12h, 24h, and 48h. (B) Assessment of miR-21 levels via quantitative Real-Time PCR (qRT-PCR). (C) Protein expression evaluated using Western blot, with relative levels determined. Band densities quantified by ImageJ. Data expressed as mean ± standard deviation, n = 3. Statistical significance established at *P < 0.05, **P < 0.01, through one-way ANOVA.
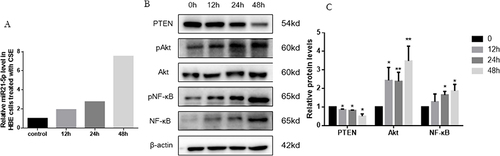
Figure 5 miR-21 targeting PTEN. (A) The binding site of miR-21 and PTEN; (B) Luciferase reporter assay was used to detect the regulatory association between miR-21 and PTEN. Data expressed as mean ± standard deviation, n = 3. Statistical significance established at *P < 0.05.
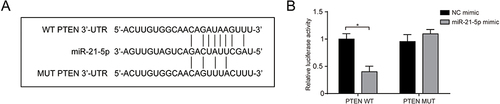
Figure 6 MiR-21 activating Akt/NF-κB pathway via inhibition of PTEN in HBE cells. (A) Treatment of HBE cells involved miR-21 inhibitor and a control inhibitor over a 48-hour period, followed by CSE exposure for another 48 hours. (B) MiR-21 expression quantified using qRT-PCR. Analysis of PTEN, p-Akt, and p-NF-κB protein levels via Western blot. (C) ImageJ utilized for measuring band densities. Labels: MiR-21i (miR-21 inhibitor), Con-inhibitor (control for miR-21 inhibitor). Statistical data: averages ± standard deviation, n = 3, significance denoted as *P < 0.05, **P < 0.01, determined through one-way ANOVA.
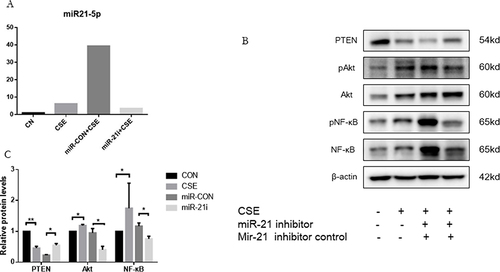
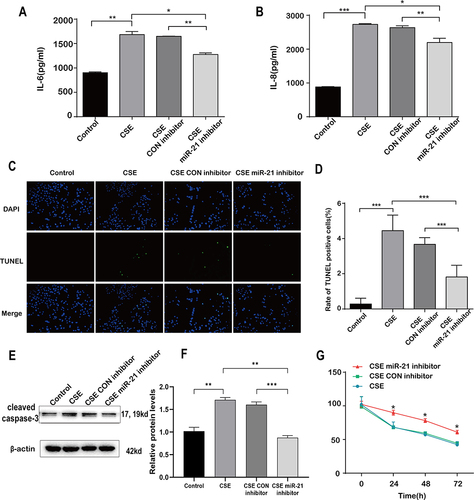
Figure 7 Decreased inflammation and apoptosis of A549 in co culture with HBE cells transfected with miR-21 inhibitor. HBE cells were co-cultured with A549 cells which were transfected with control inhibitor or miR-21 inhibitor and then treated with CSE for 48h. A549 cells are divided into four groups according to co-cultured HBE cells: control, CSE, CSE plus control inhibitor and CSE plus miR-21 inhibitor. (A) IL-6 and (B) IL-8 levels were measured by ELISA. (C) TUNEL-positive staining (in green) and DAPI (in blue) of A549 cells co-cultured with HBE cells (200x). (D) Quantitative analysis of TUNEL positive cells. (E)Western blot were determined and (F) relative protein levels of caspase-3 in A549 cells co-cultured with HBE cells. (G) Cell viability was measured by CCK-8 assay after co-cultured with HBE cells. Dates were mean ± SD, n=3, *P<0.05; **P < 0.01; ***P < 0.001.
Data Sharing Statement
All data generated or analyzed during this study are included in this published article.