
Figures & data
Table 1 The H&E Staining Score Standards
Figure 1 HPLC-ELSD and UHPLC-MS/MS analyses of BFP-TA. (A) HPLC diagram of BFP-TA. (B) The total ion chromatogram of nine alkaloids in a mixed standard solution was determined by UHPLC-MS/MS. (C) Chemical structures of nine alkaloids.
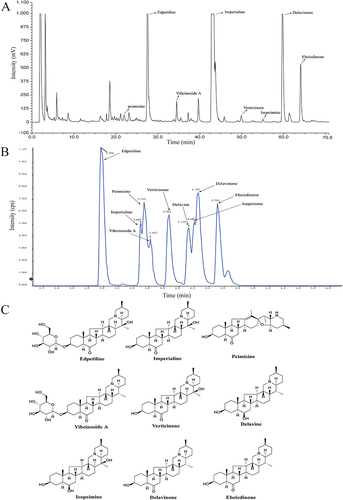
Table 2 The UHPLC-MS/MS Analysis of BFP-TA
Figure 2 Effect of BFP-TA on the general appearance, weight, and lung morphological changes in the COPD mouse model. (A) Method of mice experiments. (B) The body weight changes of each group of mice within 8–12 weeks. (C) Body weight of mice in each group at week 12. (D) Representative images of the lung morphology of mice in each group. (E) The lung-body ratio of mice in each group. Data were presented as mean ± SD (n=20), ###P < 0.001, ####P < 0.0001 compared to the control group; *P < 0.05, ****P < 0.0001 compared to the COPD model group; ΔΔP < 0.01, ΔΔΔP < 0.001 compared to the Dexa group.
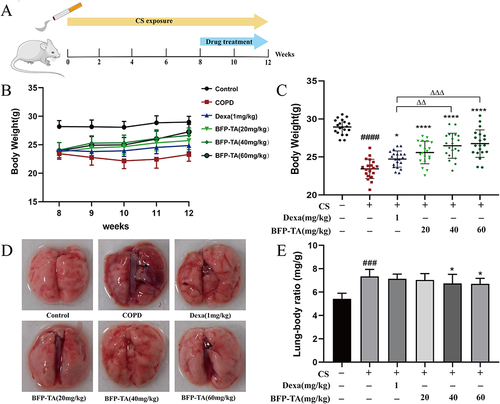
Figure 3 Effect of BFP-TA on pulmonary function in the COPD mouse model. (A–E) FRC, Cchord, FEV100/FVC, RI, and PEF in each group of mice were determined by pulmonary function measurement. Data were presented as mean ± SD (n=6), #P < 0.05, ##P < 0.01, ###P < 0.001 compared to the control group; *P < 0.05, **P < 0.01, ***P < 0.001 compared to the COPD model group.
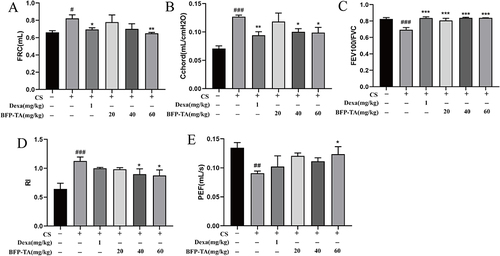
Figure 4 Effect of BFP-TA on lung histopathology in the COPD mouse model. (A) Representative images of H&E staining in each group of mice (100×). (B) H&E staining score in each group of mice. (C) Representative images of Masson’s trichrome staining in each group of mice (100×). (D) Collagen fibers volume fraction in each group of mice. Data were presented as mean ± SD (n=6), ####P < 0.0001 compared to the control group; ****P < 0.0001 compared to the COPD model group; ΔP < 0.05 compared to the Dexa group.
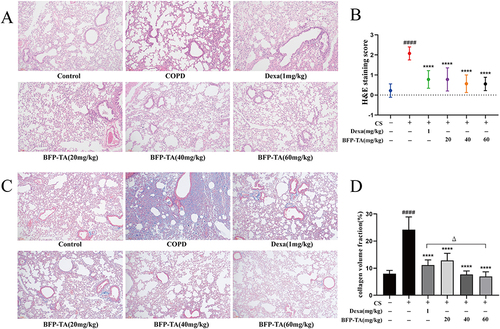
Figure 5 Effect of BFP-TA on pro-inflammatory cytokines, MMPs, and oxidative stress cytokines in the COPD mouse model. (A–C) The levels of TNF-α, IL-6, and IL-1β in the serum of each group of mice. (D–F) The levels of MMP-9, MMP-12, and TIMP-1 in the serum of each group of mice. (G–H) The levels of MDA and SOD in the serum of each group of mice. Data were presented as mean ± SD (n=6), ##P < 0.01, ###P < 0.001, ####P < 0.0001 compared to the control group; *P < 0.05, **P < 0.01, ***P < 0.001, ****P < 0.0001 compared to the COPD model group; ΔP < 0.05, ΔΔP < 0.01 compared to the Dexa group.
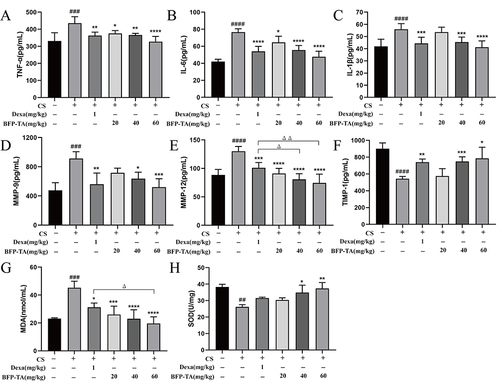
Figure 6 Effect of BFP-TA on the expression of EMT-related proteins in the COPD mouse model. (A–H) The relative expression levels of Collagen I, E-cadherin, Vimentin, α-SMA, MMP-9, TIMP-1, and Bax were determined by Western blot. Data were presented as mean ± SD (n =3), #P < 0.05, ###P < 0.001, ####P < 0.0001 compared to the control group; *P < 0.05, **P < 0.01, ***P < 0.001, ****P < 0.0001 compared to the COPD model group.
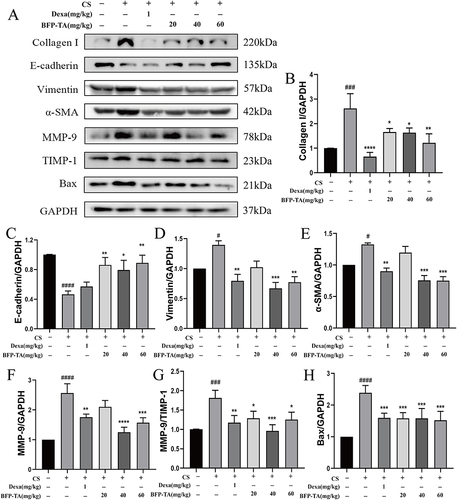
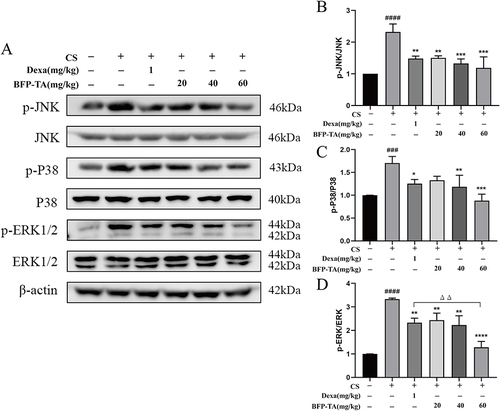
Figure 7 Effect of BFP-TA on the expression of MAPK signaling pathway-related proteins in the COPD mouse model. (A–D) The relative expression levels of p-JNK, JNK, p-P38, P38, p-ERK1/2, and ERK1/2 were determined by Western blot. Data were presented as mean ± SD (n =3), ###P < 0.001, ####P < 0.0001 compared to the control group; *P < 0.05, **P < 0.01, ***P < 0.001, ****P < 0.0001 compared to the COPD model group; ΔΔP < 0.01 compared to the Dexa group.
Data Sharing Statement
The data that support the findings of this study are available from the corresponding author upon reasonable request. We have permission to collect the plant samples under study. The study methods comply with Chinese guidelines.