Figures & data
Table 1 Descriptive and paired comparison analysis of psychometric and pneumological parameters at baseline and at 3 months in the total sample of patients with COPD in a pulmonary rehabilitation program
Table 2 Descriptive and paired comparison analysis of psychometric and pneumological parameters at baseline and at 3 months in the depression-positive subgroup (n=38) and the depression-negative subgroup (n=14) of patients with COPD in a rehabilitation program
Figure 1 Scatterplot of absolute variations of HAM-D and fat mass from baseline to 3 months in the total sample of patients with COPD in a pulmonary rehabilitation program.
Abbreviation: HAM-D, Hamilton Depression Rating Scale.
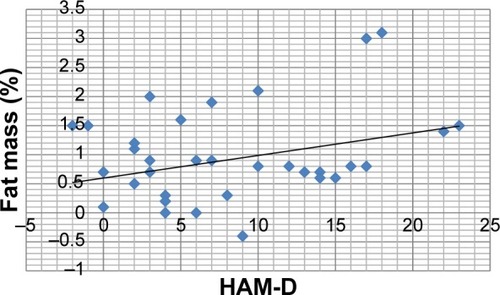
Figure 2 Scatterplot of absolute variations of HAM-D and BMI from baseline to 3 months in the total sample of patients with COPD in a pulmonary rehabilitation program.
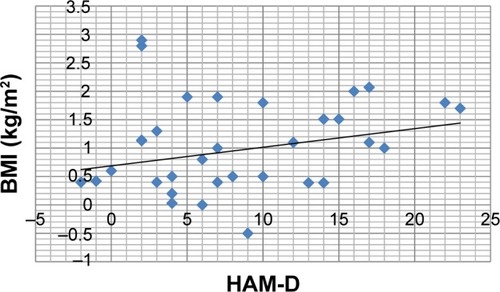
Table 3 Unpaired comparison analysis of the differences following pulmonary rehabilitative treatment between the D and ND subgroups of patients with COPD
Table 4 Correlation analysis of the difference in psychometric and pneumological parameters, observed at baseline and at 3 months in the subgroup (n=38) of depression-positive subjects with COPD in a pulmonary rehabilitation program
Table 5 Correlation analysis of the difference in psychometric and pneumological parameters, observed at baseline and at 3 months in the subgroup (n=14) of depression-negative subjects with COPD in a pulmonary rehabilitation program
Figure 3 Scatterplot of absolute variations of fat mass and HADS-D from baseline to 3 months in the depression-positive subgroup of patients with COPD in a pulmonary rehabilitation program.
Abbreviation: HADS-D, Hospital Anxiety and Depression Scale, depression subscale.
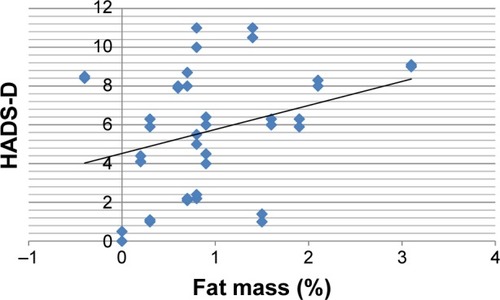
Figure 4 Scatterplot of absolute variations of fat mass and HADS-A from baseline to 3 months in the depression-positive subgroup of patients with COPD in a pulmonary rehabilitation program.
Abbreviation: HADS-A, Hospital Anxiety and Depression Scale, anxiety subscale.
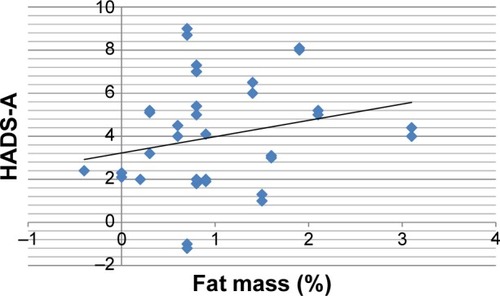
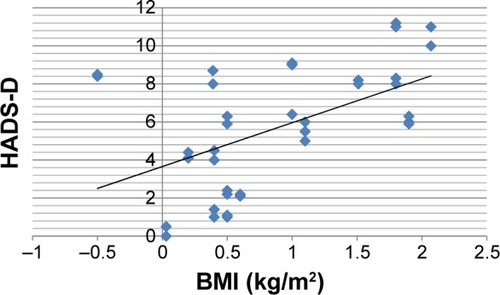
Figure 5 Scatterplot of absolute variations of BMI and HADS-A from baseline to 3 months in the depression-positive subgroup of patients with COPD in a pulmonary rehabilitation program.
Abbreviations: BMI, body mass index; HADS-A, Hospital Anxiety and Depression Scale, anxiety subscale.
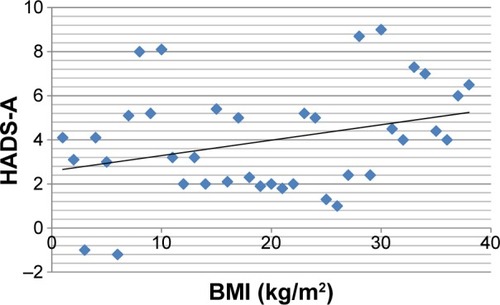
Figure 6 Scatterplot of absolute variations of BMI and HADS-D from baseline to 3 months in the depression-positive subgroup of patients with COPD in a pulmonary rehabilitation program.