
Figures & data
Figure 1 Illustrative curves constructed with mean values of each group.
Notes: (A) Control group (ETCO2=36 mmHg; Slp3=7.3 mmHg/L; Ve =693.2±245.9 mL; (B) airways diseases group (ETCO2=39.0±6.7 mmHg; Slp3=37.1±15.5 mmHg/L; Ve =508.5 mL); (C) emphysema group (ETCO2=33.7±6.8 mmHg; Slp3=28.6±12.7 mmHg/L; Ve =652.1 mL). Data from Veronez et al.Citation15
Abbreviations: ETCO2, end-tidal CO2; Slp3, slope of phase 3; Ve, expired volume.
Abbreviations: ETCO2, end-tidal CO2; Slp3, slope of phase 3; Ve, expired volume.
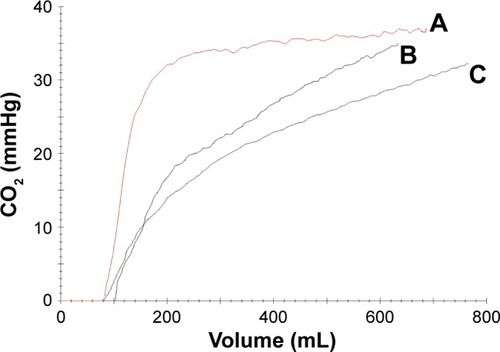
Table 1 Scoring system for CT findings
Figure 2 Flowchart of patients included in the study.
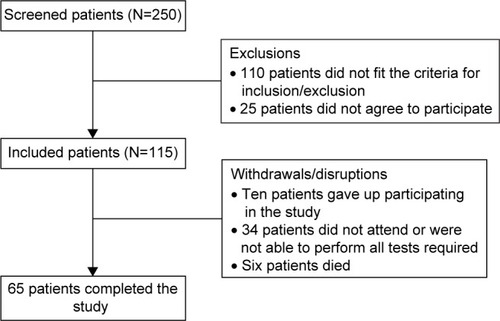
Table 2 Clinical and functional characteristics of patients (N=65)
Table 3 HRCT findings of all patients (N=65)
Table 4 HRCT findings, clinical and functional characteristics of patients according to CT phenotype
Table 5 Comparison of patients according to the presence or absence of air trapping on CT expiratory scans (N=44)
Table 6 Correlation between CT score and spirometric variables, 6MWT and volumetric capnography