
Figures & data
Table 1 Baseline characteristics of patients
Table 2 PASAPQ scores by treatment
Figure 1 Mean PASAPQ scores by treatment.
Abbreviations: PASAPQ, Patient Satisfaction and Preference Questionnaire; SD, standard deviation.
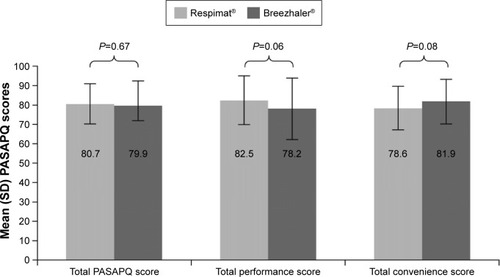
Figure 2 Distribution of total PASAPQ scores.
Abbreviation: PASAPQ, Patient Satisfaction and Preference Questionnaire.
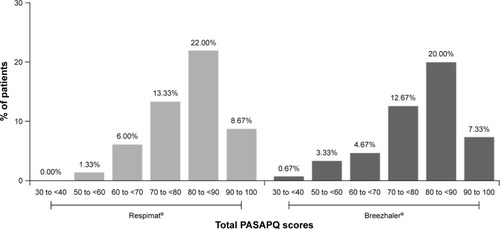
Table 3 PASAPQ scores stratified by age groups
Table 4 PASAPQ scores stratified by smoking status
Table 5 PASAPQ scores stratified by time since diagnosis of COPD
Table S1 Validated questions included in the modified PASAPQ