
Figures & data
Figure 1 CONSORT diagram.
Abbreviations: SPACE, Self-management Program of Activity, Coping, and Education; PR, pulmonary rehabilitation; MRC, Medical Research Council; UHCW, University Hospitals Coventry and Warwickshire NHS Trust; UHL, University Hospitals of Leicester NHS Trust.
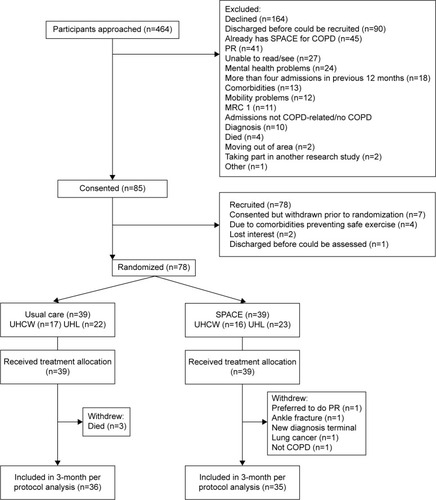
Table 1 Baseline characteristics of the study population
Figure 2 Kaplan–Meier plots showing risk of respiratory readmission by randomization.
Abbreviation: SPACE, Self-management Program of Activity, Coping, and Education.
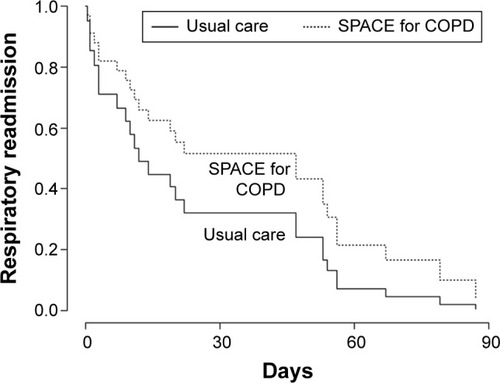
Table 2 Hospital length of stay (for readmission)
Table 3 Baseline and change in secondary outcome measures at 3 months
Table 4 Number (%) of participants who achieved the MCID
Figure 3 Change in Chronic Respiratory Questionnaire – self reported data from baseline to 3 months.
Note: *P<0.05, **P<0.01, within group difference.
Abbreviations: NS, not significant; SPACE, Self management Programme of Activity Coping and Education; CRQ, Chronic Respiratory Questionnaire.
Abbreviations: NS, not significant; SPACE, Self management Programme of Activity Coping and Education; CRQ, Chronic Respiratory Questionnaire.
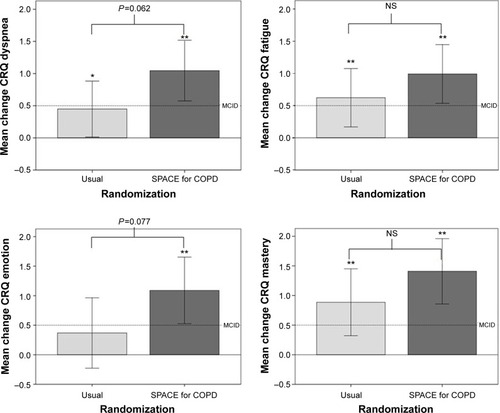
Table 5 How people feel upon discharge from hospital following treatment for their COPD (% per group)
Table 6 Effect of (baseline) hospitalization on how people felt they changed and consequently managed their COPD (%)