
Figures & data
Figure 1 Patient disposition.
Abbreviations: FF/VI, fluticasone furoate/vilanterol (100/25 mcg); TIO, tiotropium (18 mcg).
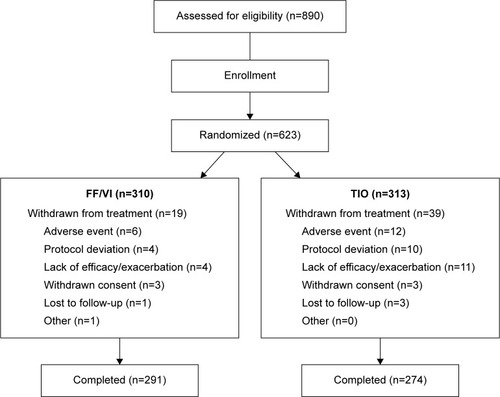
Table 1 Summary of demographic and baseline characteristics
Figure 2 Box plot of change from baseline in 24-h weighted mean FEV1 (L).
Notes: Box represents the IQR, midline represents the median, + represents the mean, whiskers represent 1.5× IQR, circles represent subjects exceeding 1.5× IQR. P=0.201.
Abbreviations: FEV1, forced expiratory volume in 1 second; FF/VI, fluticasone furoate/vilanterol (100/25 mcg); h, hours; IQR, interquartile range; TIO, tiotropium (18 mcg).
Abbreviations: FEV1, forced expiratory volume in 1 second; FF/VI, fluticasone furoate/vilanterol (100/25 mcg); h, hours; IQR, interquartile range; TIO, tiotropium (18 mcg).
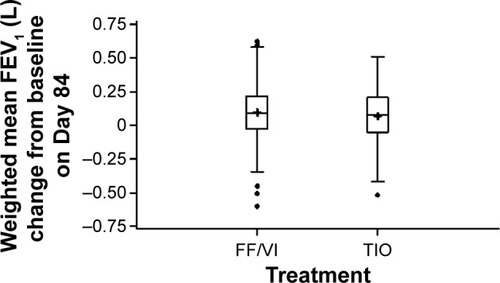
Table 2 Time to onset of action (postdose change from baseline of ≥100 mL) on treatment day 1
Table 3 Other efficacy endpoints
Figure 3 Weekly rescue medication use.
Notes: (A) Mean weekly use of albuterol/salmeterol rescue medication in inhalations/day over the 12-week course of the study and (B) mean weekly percentage of rescue-free days over the 12-week course of the study. During Weeks 1–12, the LS mean change difference between groups was (A) −0.37 inhalations (95% CI −0.55 to −0.19) and (B) 9.1% (95% CI 4.0–14.2). Albuterol use was measured as occasions used/day.
Abbreviations: CI, confidence interval; FF/VI, fluticasone furoate/vilanterol (100/25 mcg); LS, least squares; TIO, tiotropium (18 mcg).
Abbreviations: CI, confidence interval; FF/VI, fluticasone furoate/vilanterol (100/25 mcg); LS, least squares; TIO, tiotropium (18 mcg).
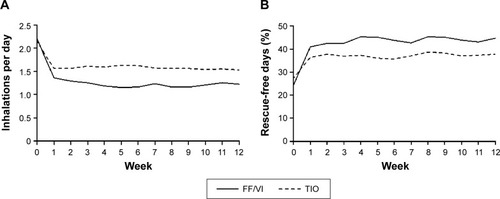
Figure 4 Least squares mean change from baseline in (A) total SGRQ-C score and (B) total CAT score at Weeks 4, 8, and 12.
Notes: The LS mean change difference between groups for Week 4 was (A) −2.25 (95% CI −4.00 to −0.51) and (B) −0.9 (95% CI −1.8 to 0.0), for Week 8 was (A) −2.84 (95% CI −4.70 to −0.99) and (B) −0.7 (95% CI −1.6 to 0.2), and for Week 12 was (A) −1.38 (95% CI −3.38 to 0.62) and (B) −0.4 (95% CI −1.3 to 0.5). The MCID of −4 is indicated by a dotted line.
Abbreviations: CAT, COPD Assessment Test; CI, confidence interval; FF/VI, fluticasone furoate/vilanterol (100/25 mcg); LS, least squares; MCID, minimal clinically important difference; SGRQ-C, St George’s Respiratory Questionnaire-COPD; TIO, tiotropium (18 mcg).
Abbreviations: CAT, COPD Assessment Test; CI, confidence interval; FF/VI, fluticasone furoate/vilanterol (100/25 mcg); LS, least squares; MCID, minimal clinically important difference; SGRQ-C, St George’s Respiratory Questionnaire-COPD; TIO, tiotropium (18 mcg).
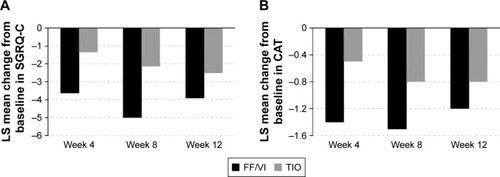
Table 4 Adverse eventsTable Footnotea