Figures & data
Figure 1 Hypothesis for the mode of action of roflumilast.
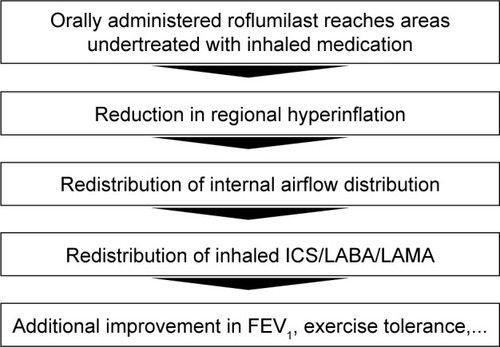
Table 1 Patient characteristics and demographics after randomization
Figure 2 CONSORT diagram of the clinical trial.
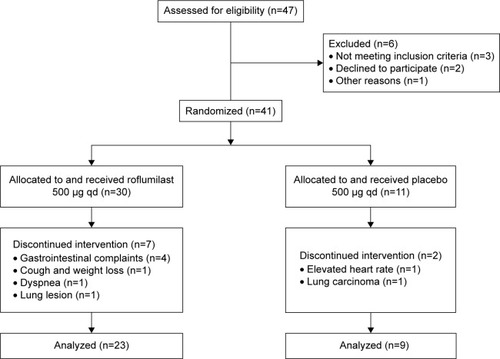
Figure 3 Regional hyperinflation at the FRC level for a COPD patient from the roflumilast trial and a healthy volunteer (both female, both 170 cm in height).
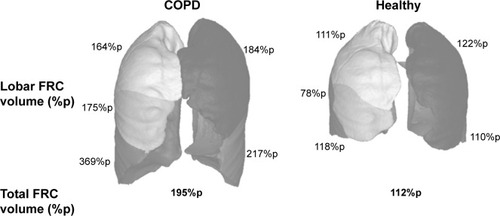
Table 2 Aerosol characteristics of LAMA and LABA/ICS used in the FRI deposition calculations
Figure 4 Negative correlation between the lobar blood vessel density and the change in lobar hyperinflation in the roflumilast responder group after 6 months of treatment.
Note: Better-perfused lobes experience larger reduction in hyperinflation.
Abbreviation: %p, percentage of predicted.
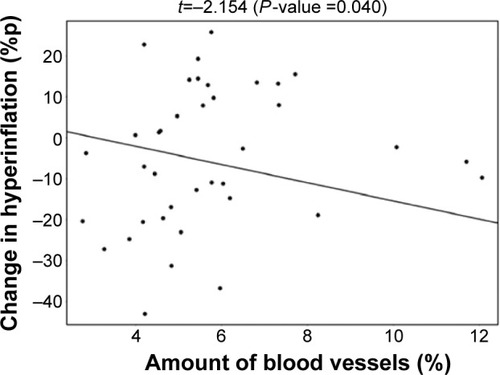
Figure 5 No correlation between the lobar blood vessel density and the change in lobar hyperinflation in the placebo group.
Abbreviation: %p, percentage of predicted.
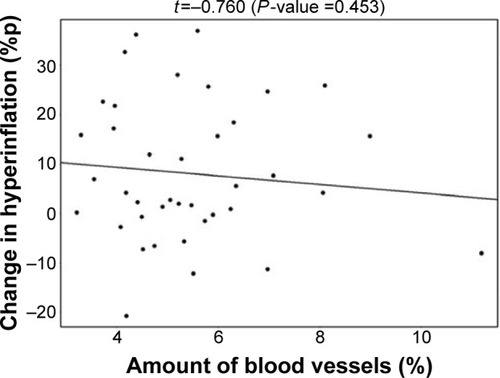
Figure 6 Negative correlation between the change in lobar hyperinflation and the change in lobar ventilation in the Roflumilast responder group after 6 months of treatment.
Note: Lobes that experience a larger reduction in hyperinflation are better ventilated.
Abbreviation: %p, percentage of predicted.
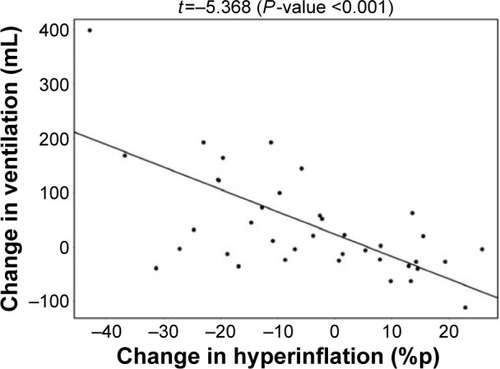
Figure 7 Positive correlation between the change in lobar ventilation and the change in lobar aerosol deposition in the roflumilast responder group after 6 months of treatment.
Note: Lobes that are better ventilated consequently experience more drug deposition.
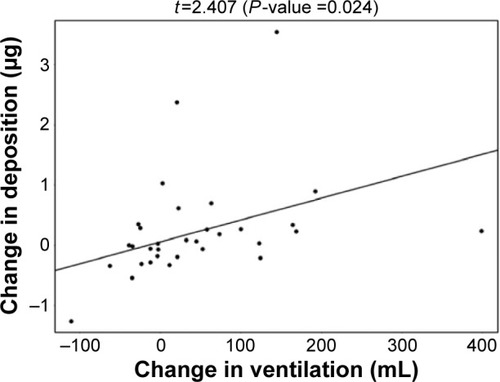
Figure 8 Positive correlation between the change in lobar aerosol deposition and the change in lobar CT-based bronchodilation (iVaw) in the roflumilast responder group after 6 months of treatment.
Note: Lobes with higher deposition had more bronchodilation.
Abbreviations: CT, computed tomography; iVaw, image-based airway volume.
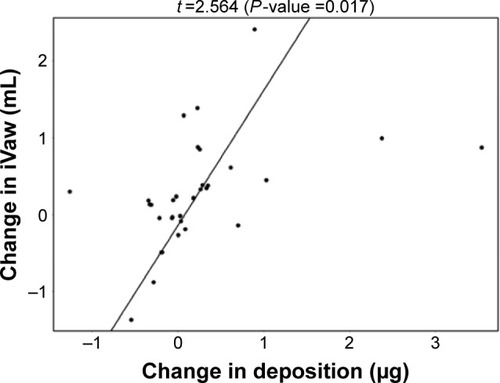
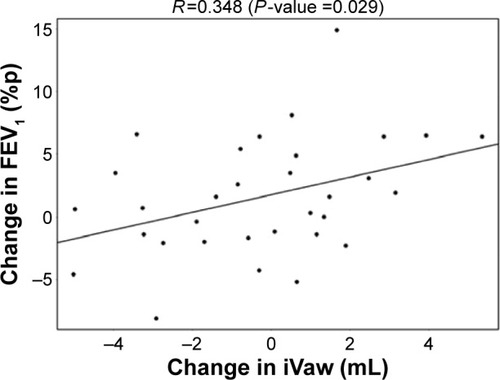
Figure 9 Positive correlation between the change in CT-based bronchodilation (iVaw) and the observed changes in FEV1.
Abbreviations: CT, computed tomography; FEV1, forced expiratory volume in 1 second; iVaw, image-based airway volume; %p, percentage of predicted.