
Figures & data
Table 1 Baseline characteristics of the population included in the analysis
Table 2 Risk equation to incorporate Spanish utilities (linear regression model)
Table 3 Unitary costs of health care resources included in the analysis
Table 4 Deterministic sensitivity analysis values
Table 5 Results of base case
Figure 1 Results of the sensitivity analysis.
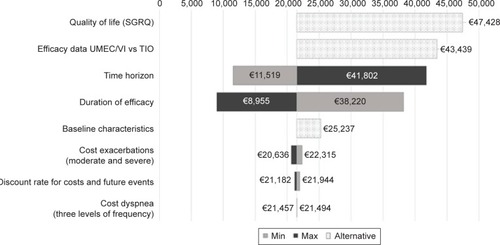
Figure 2 Probabilistic sensitivity analysis results. Cost-effectiveness plane.
Abbreviations: QALYs, quality-adjusted life years; UMEC/VI, umeclidinium and vilanterol; TIO, tiotropium.
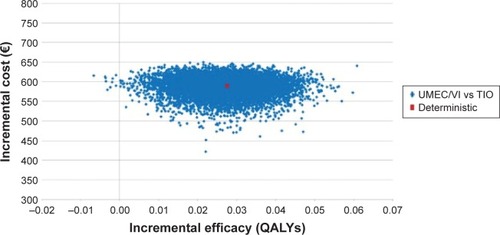
Figure 3 Acceptability curve.
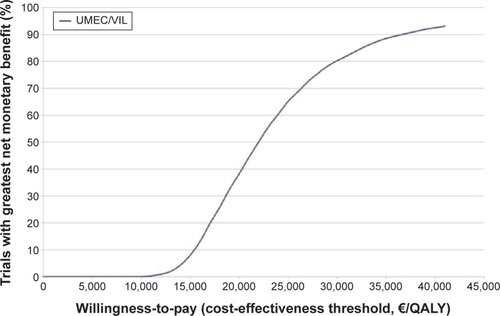
Table S1 Risk equations developed for utility estimation
Table S2 Variables considered in each of the risk equations
Table S3 Results obtained considering risk equations developed for utility estimation