
Figures & data
Table 1 Preoperative characteristics of lung cancer patients
Table 2 Perioperative characteristics of lung cancer patients
Table 3 Postoperative pulmonary complications and mortality
Table 4 Comparison of cause of death between CPFE and emphysema groups
Figure 1 Overall survival in the four groups: Kaplan–Meier curves for OS after surgery.
Abbreviations: OS, overall survival; CPFE, combined pulmonary fibrosis and emphysema; IP, interstitial pneumonia.
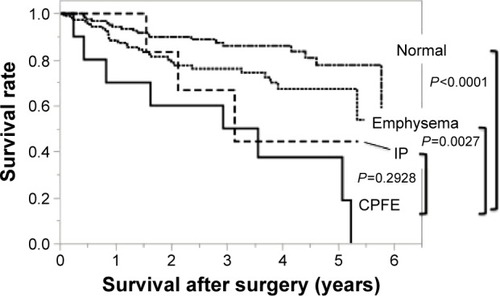
Figure 2 Disease-specific survival in the four groups: Kaplan–Meier curves for disease-specific survival.
Abbreviations: CPFE, combined pulmonary fibrosis and emphysema; IP, interstitial pneumonia.
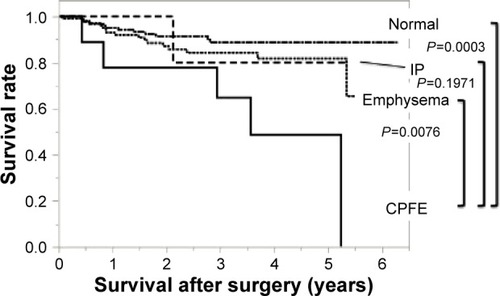
Figure 3 Overall survival in the four groups with pathological stage I disease: Kaplan–Meier curves for overall survival with pathological stage I disease.
Abbreviations: CPFE, combined pulmonary fibrosis and emphysema; IP, interstitial pneumonia.
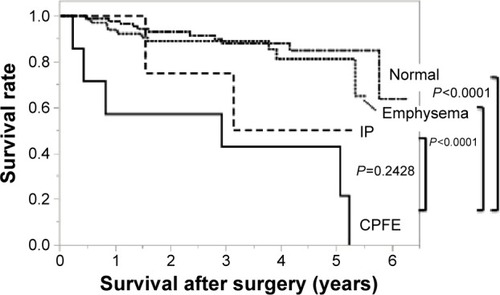
Table 5 Univariate analysis of prognostic factors using Cox proportional hazard model
Table 6 Multivariate analysis of prognostic factors using Cox proportional hazard model