
Figures & data
Table 1 Demographics and baseline characteristics of all subjects in the hepatic and renal impairment studies
Table 2 Pharmacokinetic parameters of olodaterol after administration of a single inhaled dose of 20 μg to subjects with mild or moderate hepatic impairment and 30 μg to healthy subjects
Table 3 Geometric mean ratios and 90% CIs of olodaterol pharmacokinetic parameters of hepatically or renally impaired subjects versus healthy subjects
Figure 1 Geometric mean plasma concentration–time profiles after single inhaled administration of 20 μg olodaterol in subjects with mild (![]()
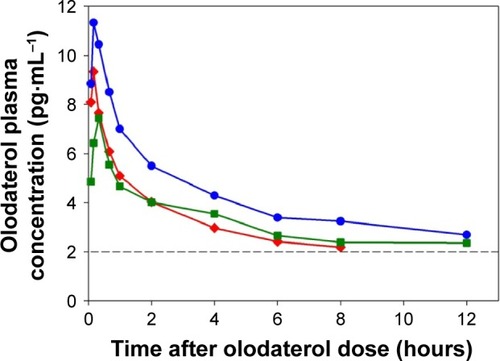
Table 4 Pharmacokinetic parameters of olodaterol after administration of a single inhaled dose of 30 μg to subjects with severe renal impairment and healthy subjects
Figure 2 Geometric mean plasma concentration–time profiles after single inhaled administration of 30 μg olodaterol in subjects with severe renal impairment (![]()
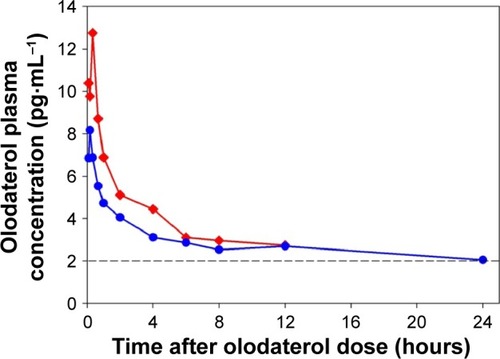
Figure 3 Time course of serum potassium concentrations by subject group (mean ± SD).
Abbreviation: SD, standard deviation.
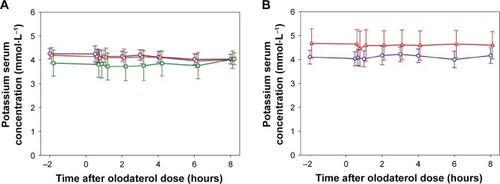
Table S1 Pharmacokinetic parameters of olodaterol after administration of a single inhaled dose of 20 μg to subjects with moderate hepatic impairment
Table S2 Geometric mean ratios and 90% CIs of olodaterol pharmacokinetic parameters in subjects with moderate hepatic impairment versus healthy subjects