
Figures & data
Figure 1 Patient flow diagram.
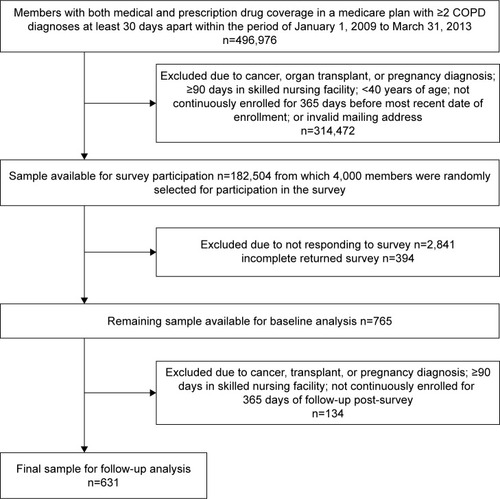
Table 1 Baseline demographic and clinical characteristics of survey respondents and non-respondents; completers and non-completers
Table 2 Baseline demographic and clinical characteristics of low- and high-symptom patients by mMRC and CAT among survey completers (n=765)
Table 3 GOLD classification by symptom as captured by mMRC and CAT
Table 4 GOLD classifications by symptom and exacerbation history
Figure 2 Exacerbations during follow-up by risk and symptoms.
Notes: (A) In each box plot the mean (standard deviation) is reported and is represented by the cross symbol. (a) Low risk – low mMRC symptom; (b) low risk – high mMRC symptom; (c) high risk – low mMRC symptom; (d) high risk – high mMRC symptom. Low risk – history of <2 exacerbations; high risk – history of ≥2 exacerbations. Low-symptom mMRC score <2; high-symptom mMRC score ≥2. (B) In each box plot the mean (standard deviation) is reported and is represented by the cross symbol. (a) Low risk – low CAT symptom; (b) low risk – high CAT symptom; (c) High risk – low CAT symptom; (d) High risk – high CAT symptom. Low risk – history of <2 exacerbations; high risk – history of ≥2 exacerbations. Low-symptom CAT score <10; high-symptom CAT score ≥10.
Abbreviations: CAT, COPD assessment test; mMRC, modified Medical Research Council.
Abbreviations: CAT, COPD assessment test; mMRC, modified Medical Research Council.
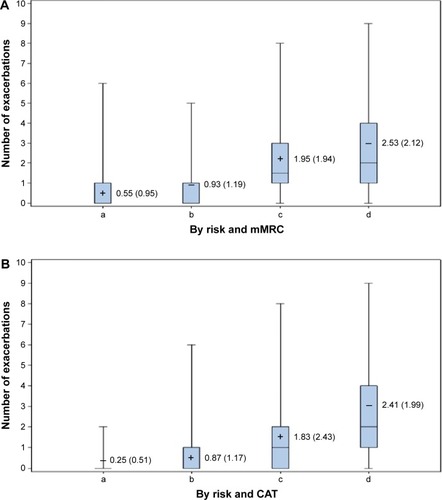
Table 5 Logistic regression of factors associated with post-index exacerbations (≥1/0)Table Footnotea
Table 6 Generalized linear model for exacerbation-related costs (log link and Gamma distribution)Table Footnotea