
Figures & data
Table 1 Subject characteristics
Figure 1 Hierarchical clustering of cytokine-PAMP combinations by subject.
Notes: In the heatmap, each column corresponds to an individual patient. The presence or absence (Y/N) of chronic bronchitis or severe COPD (FEV1<50%) is indicated at the top for each patient. Each row corresponds to cytokine production in response to a specific PAMP. Several cytokines formed distinct clusters in response to multiple PAMPs (IL-1RA, G-CSF, MCP-1, IL-10, IL-8) and have been highlighted. Note the aggregation of multiple subjects with severe COPD in the “low responder” group.
Abbreviations: PAMP, pathogen-associated molecular pattern; IL, interleukin; G-CSF, granulocyte-colony stimulating factor.
Abbreviations: PAMP, pathogen-associated molecular pattern; IL, interleukin; G-CSF, granulocyte-colony stimulating factor.
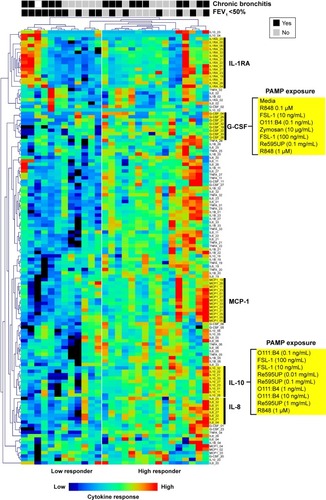
Table 2 Differences in IL-10 levels by COPD disease severity after stimulation of whole blood by PAMPs
Table 3 Differences in G-CSF levels by COPD disease severity after stimulation of whole blood by PAMPs
Table 4 Differences in IL-1β levels by COPD disease severity after stimulation of whole blood by PAMPs
Figure 2 Heatmap showing the strength of tests of associations comparing cytokine levels for subjects with and without severe COPD or chronic bronchitis for each PAMP–cytokine level pair.
Notes: Each square corresponds to the P-value for one Student’s t-test comparing cytokine levels after stimulation with a PAMP between subjects with and without severe COPD (A) or with and without chronic bronchitis (B). For example, the square in the upper right corner shows the P-value for the Student’s t-test comparing MCP-1 levels in response to media (no PAMP) between those with and without severe COPD. *Student’s t-test comparing the mean log-transformed cytokine values for a given PAMP between subjects with and without severe COPD. **Student’s t-test comparing the mean log-transformed cytokine values for a given PAMP between subjects with and without chronic bronchitis.
Abbreviations: PAMP, pathogen-associated molecular pattern; IL, interleukin; TNF, tumor necrosis factor; G-CSF, granulocyte-colony stimulating factor.
Abbreviations: PAMP, pathogen-associated molecular pattern; IL, interleukin; TNF, tumor necrosis factor; G-CSF, granulocyte-colony stimulating factor.
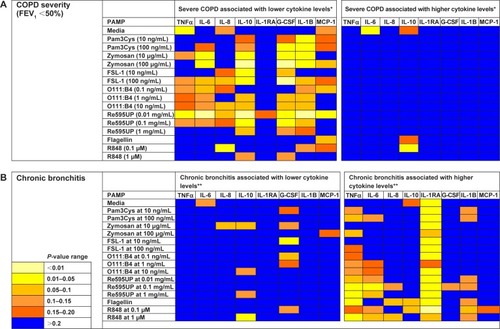
Table 5 Differences in IL-1RA levels by history of chronic bronchitis after stimulation of whole blood by PAMPs