
Figures & data
Figure 1 Study design.
Abbreviations: R, randomization; S, screening.
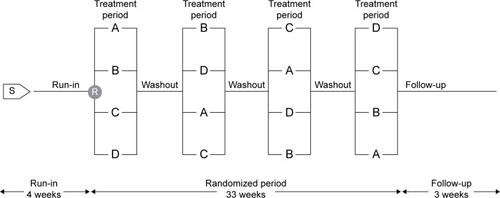
Figure 2 Patient disposition.
Abbreviation: AE, adverse event.
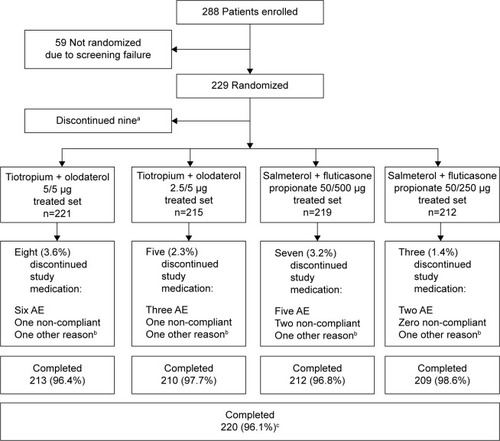
Table 1 Demographic and baseline patient characteristics (treated population)
Table 2 Adjusted mean FEV1 AUC responses after 6 weeks of treatment (full analysis set)
Table 3 Adjusted mean FEV1 AUC0–12, AUC0–24, and AUC12–24 responses after 6 weeks of treatment, showing the treatment differences (full analysis set)
Figure 3 Adjusted mean 24-hour FEV1 profile after 6 weeks of treatment (full analysis set).
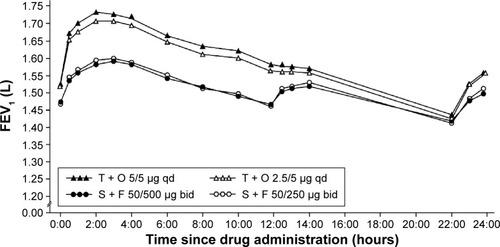
Table 4 Peak0–3 FEV1 response at study Day 1 and Day 43 and trough FEV1 responses after 6 weeks of treatment (full analysis set)
Table 5 Peak0–3 FEV1 response at study Day 1 and Day 43 and trough FEV1 responses after 6 weeks of treatment, showing the differences between treatments (full analysis set)
Figure 4 Adjusted mean 24-hour FVC profile after 6 weeks of treatment (full analysis set).
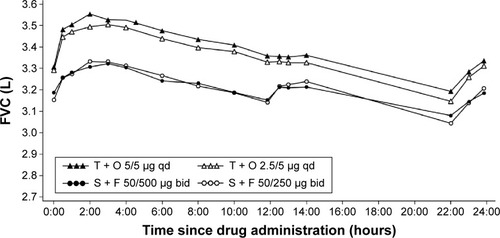
Table 6 Summary of AEs (treated population)
Table S1 Additional exclusion criteria
Table S2 Adjusted mean FVC AUC0–12, AUC0–24, and AUC12–24 responses after 6 weeks of treatment: treatment differences (full analysis set)
Table S3 Adjusted mean FVC AUC0–3, trough FVC, and peak0–3 FVC responses after 6 weeks of treatment: treatment differences (full analysis set)