Figures & data
Table 1 Subject demographics
Figure 1 nSMase-2 labeling in human lung tissue.
Notes: Representative images for nSMase-2 expression (brown) within the peripheral lung tissue from (A, D, G) NS, (B, E, H) S, and (C, F, I) COPD patients. nSMase-2 was detected within the small airway epithelium (A–F) with a more pronounced expression toward the apical surface (inset arrow). nSMase-2 was also detected within the alveolar macrophages and alveolar walls (G–I). nSMase-2-positive alveolar macrophages (black arrows) observed near alveolar macrophages lacking nSMase-2 expression (red arrows). Magnification ×200 (A–C) ×600 (D–I).
Abbreviations: NS, nonsmoker; S, smoker.
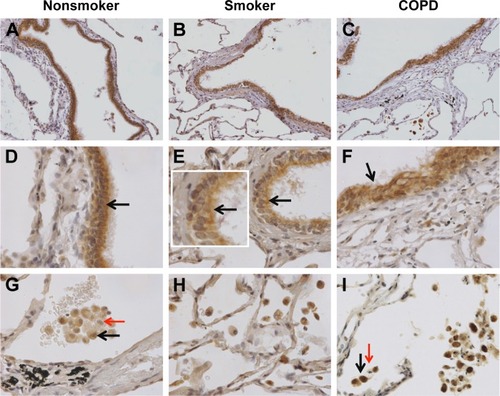
Figure 2 Quantification of nSMase-2 in lung tissue.
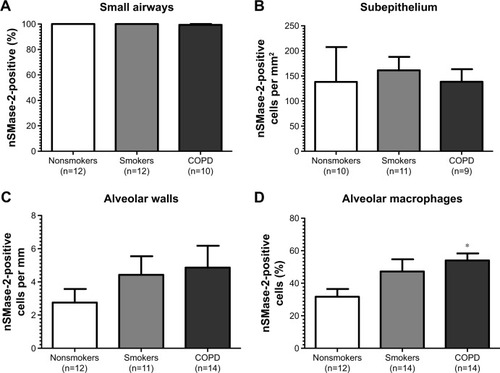
Figure 3 aSMase labeling in human lung tissue.
Notes: Representative images for aSMase expression (brown) within the peripheral lung tissue from (A, D, G) NS, (B, E, H) S, and (C, F, I) COPD patients. aSMase was detected within the small airway epithelium (A–F) with a pronounced nuclear expression (inset arrow). aSMase was also detected within the alveolar macrophages and alveolar walls (G–I). aSMase-positive alveolar macrophages (black arrows) observed near alveolar macrophages lacking nSMase-2 expression (red arrows). Magnification ×200 (A–C) ×600 (D–I).
Abbreviations: NS, nonsmoker; S, smoker.
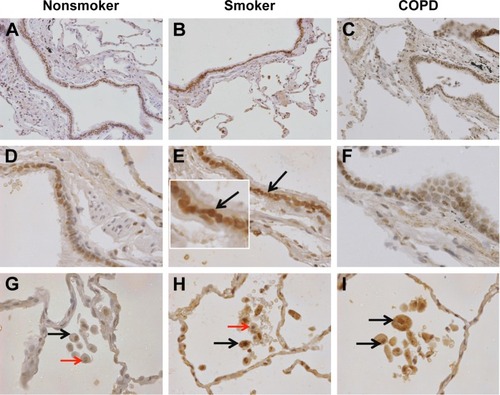
Figure 4 Quantification of aSMase labeling in lung.
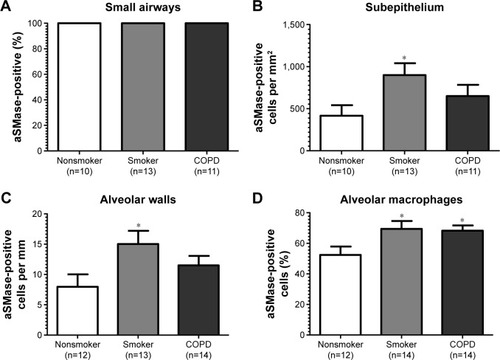
Figure 5 nSMase-2 and aSMase gene expression in alveolar macrophages.
Abbreviations: GAPDH, glyceraldehyde-3-phosphate dehydrogenase; RT-PCR, reverse transcription polymerase chain reaction; QPCR, quantitative polymerase chain reaction; NS, nonsmoker; S, smoker.
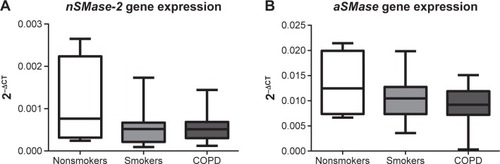
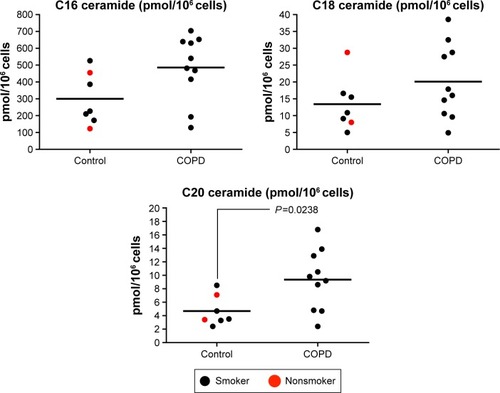
Figure 6 Quantification of ceramide species (C16, C18, and C20) in alveolar macrophages.