
Figures & data
Table 1 Summary of subject demographics and baseline characteristics
Table 2 Summary of the differences in biomarker levels before and after stimulation in PMBC and induced sputum cells (all subjects)
Figure 1 Basal release of TNF- α (pg/mL) from PBMCs in patients with COPD, non-COPD SC, and non-COPD NSC.
Notes: Data are presented as mean ± standard deviation; n=10 in each group. aDifference between COPD and non-COPD NSC groups by Dunnett’s test.
Abbreviations: TNF-α, tumor necrosis factor-alpha; LPS, lipopolysaccharide; COPD, chronic obstructive pulmonary disease; SC, smoking controls; NSC, nonsmoking controls; PBMCs, peripheral blood mononuclear cells.
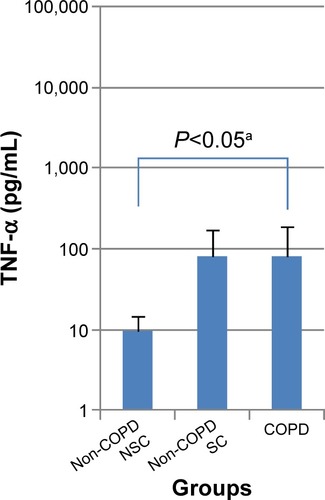
Figure 2 LPS-induced TNF-α release (pg/mL) from PBMC (A) and sputum cells (B) in patients with COPD, non-COPD SC, and non-COPD NSC.
Abbreviations: TNF-α, tumor necrosis factor-alpha; LPS, lipopolysaccharide; COPD, chronic obstructive pulmonary disease; SC, smoking controls; NSC, nonsmoking controls; PBMC, peripheral blood mononuclear cells.
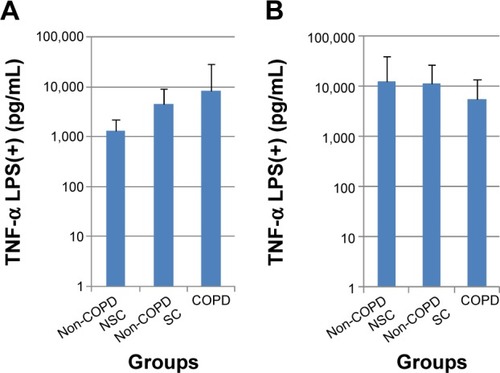
Table 3 Inflammatory cell counts in sputum
Table 4 Correlations between sputum inflammatory cell counts and sputum biomarkers in all subjects
Table S1 Summary of biomarkers in peripheral blood mononuclear cells (stimulated by TNF-α or LPS)