
Figures & data
Figure 1 Sample extraction.
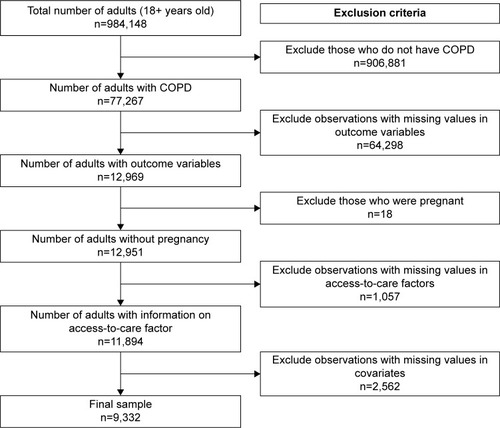
Table 1 Descriptive statistics: unweighted/weighted N=9,332/2,091,774
Table 2 Results of bivariate probit model with two outcomes (hospital/ED visit and PCP office visit) (unweighted/weighted N=9,332/2,091,774)
Table 3 Results of sensitivity analysis based on lagged values of county-level variables
Table 4 Results of subpopulation analyses based on existence of pulmonary specialists
Table S1 Correlation between outcome variables
Table S2 Results of supplementary analysis based on safety net facilities categorical variable