
Figures & data
Figure 1 Probability of all-cause death (A–F), respiratory death (G), COPD death (H), and COPD-related health care utilization (I).
Abbreviations: FEV1, forced expiratory volume in 1 second; FVC, forced vital capacity; F–U, follow-up.
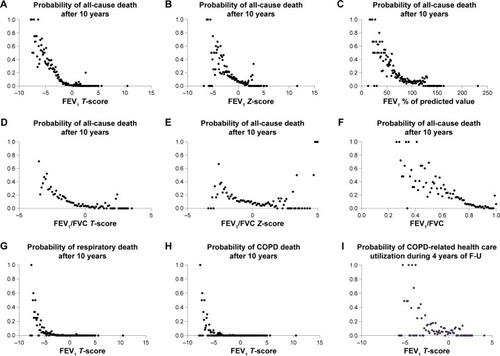
Table 1 Baseline characteristics of subjects included in this study
Figure 2 Receiver operating characteristic (ROC) curves for the prediction of all-cause death (A and E), respiratory death (B and F), COPD death (C and G), and COPD-related health care utilization (D and H).
Abbreviations: AUC, area under curve; CI, confidence interval; FEV1, forced expiratory volume in 1 second; FVC, forced vital capacity; F–U, follow-up.
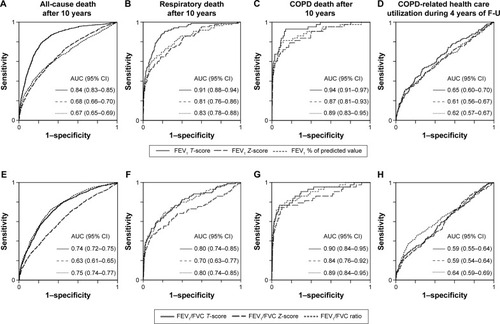
Table 2 Various criteria of abnormal spirometry for the prediction of all-cause death, respiratory death, COPD death, and COPD-related health care utilization
Figure 3 Kaplan–Meier survival curves for all-cause death (A), respiratory death (B), and COPD death (C) and also for COPD-related health care utilization (D).
Abbreviation: FEV1, forced expiratory volume in 1 second.
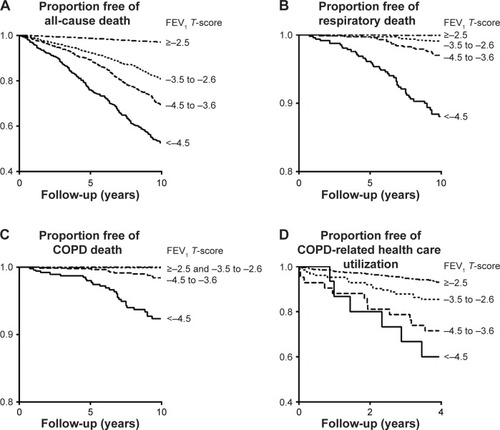
Figure S1 Flow of subjects’ selection from the US NHANES III.
Abbreviation: NHANES III, Third National Health and Nutrition Examination Survey.
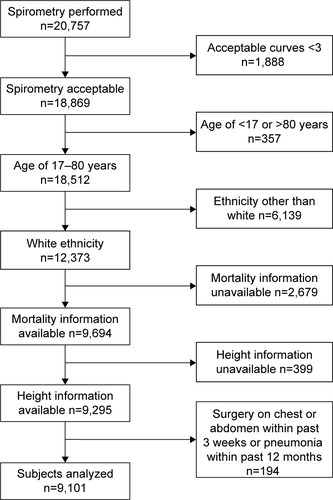
Figure S2 Flow of subjects’ selection from the Korean NHANES II.
Abbreviation: NHANES II, Second National Health and Nutritional Examination Survey.
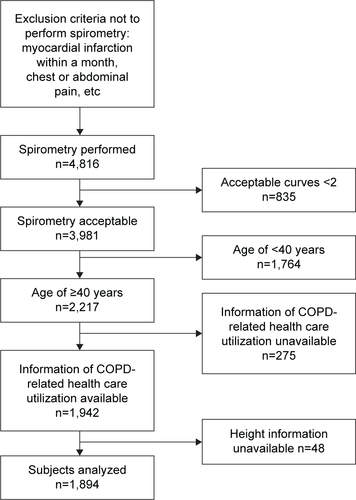
Table S1 Selection of “healthy” subjects for the development of spirometry reference values for Koreans
Table S2 Various criteria of abnormal spirometry for the prediction of COPD-related health care utilization (COPD utilization)