Figures & data
Table 1 Participant profile (mean ± SD)
Table 2 Primer sequences for real-time PCR
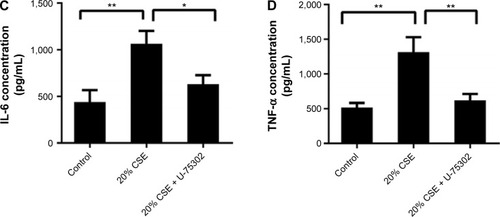
Figure 1 The distribution and expression levels of SOCS1 in lung tissue.
Notes: Immunohistochemistry of lung tissues with antibodies against SOCS1. Representative SOCS1 expression (brown staining) in sections from control (A and C) and COPD (B and D). (E) Quantification of the immunohistochemistry results, and expressed as integral optical density of brown staining in the different view of COPD and controls. The results are presented as mean ± SEM (n=12). Original magnification ×200 or ×400. ****P<0.0001.
Abbreviations: SOCS1, suppressor of cytokine signaling 1; SEM, standard error of the mean.
Abbreviations: SOCS1, suppressor of cytokine signaling 1; SEM, standard error of the mean.
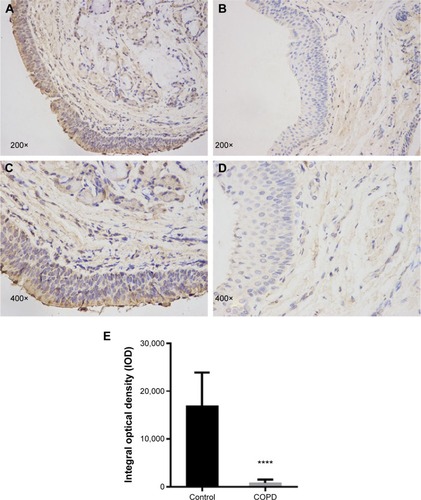
Figure 2 SOCS1 mRNA expression levels in lung tissue.
Notes: RT-qPCR detection of SOCS1 mRNA expression of lung tissue. COPD patients showed a significant low level of SOCS1 mRNA compared with the control sample. The results are presented as mean ± SEM (n=12–15; ****P<0.0001 vs the control group).
Abbreviations: RT-qPCR, real-time reverse transcription quantitative polymerase chain reaction; SOCS1, suppressor of cytokine signaling 1; SEM, standard error of the mean.
Abbreviations: RT-qPCR, real-time reverse transcription quantitative polymerase chain reaction; SOCS1, suppressor of cytokine signaling 1; SEM, standard error of the mean.
Figure 3 mRNA expression of SOCS1 and BLT1 in alveolar macrophages.
Notes: RT-qPCR detection of mRNA expression of alveolar macrophages. COPD patients showed a significant low level of SOCS1 mRNA compared with control sample (A). In contrast, BLT1 had an opposite result (B). The results are presented as mean ± SEM (*P<0.05 vs the control group).
Abbreviations: BLT1, leukotriene B4 receptor 1; RT-qPCR, real-time reverse transcription quantitative polymerase chain reaction; SOCS1, suppressor of cytokine signaling 1; SEM, standard error of the mean.
Abbreviations: BLT1, leukotriene B4 receptor 1; RT-qPCR, real-time reverse transcription quantitative polymerase chain reaction; SOCS1, suppressor of cytokine signaling 1; SEM, standard error of the mean.
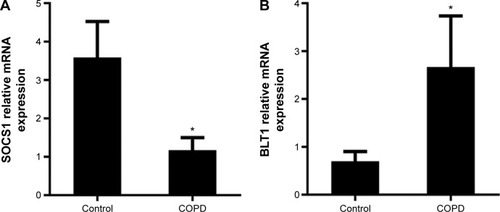
Figure 4 Cytokine concentration in bronchoalveolar lavage fluid (BALF).
Notes: BALF was assayed by ELISA, and COPD patients showed a significant high level of LTB4 (A), IL-8 (B), and TNF-α (C) compared with the control group. Data are expressed as mean ± SEM (n=15–25; **P<0.01 vs the control group, ***P<0.001 vs the control group, ****P<0.0001 vs the control group as indicated in the figure).
Abbreviations: ELISA, enzyme-linked immunosorbent assay; IL-8, interleukin-8; LTB4, leukotriene B4; TNF-α, tumor necrosis factor-α; SEM, standard error of the mean.
Abbreviations: ELISA, enzyme-linked immunosorbent assay; IL-8, interleukin-8; LTB4, leukotriene B4; TNF-α, tumor necrosis factor-α; SEM, standard error of the mean.
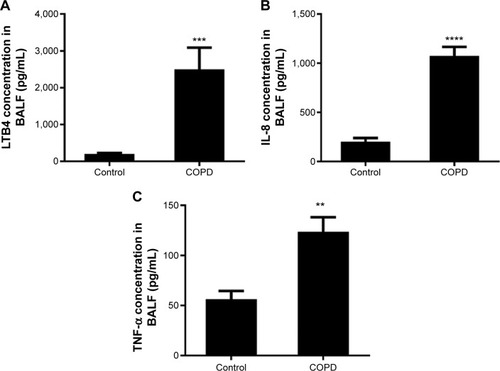
Figure 5 Correlations between SOCS1 mRNA levels, LTB4 expression level, and FEV1 %predicted.
Notes: There were significant negative correlations between SOCS1 mRNA level in lung tissues and LTB4 concentration in COPD patients (A). In addition, there were significant positive correlations between SOCS1 mRNA level of lung tissues and FEV1 %predicted (B). Data are expressed as mean ± SEM.
Abbreviations: LTB4, leukotriene B4; SOCS1, suppressor of cytokine signaling 1; FEV1, forced expiratory volume in 1 second; SEM, standard error of the mean.
Abbreviations: LTB4, leukotriene B4; SOCS1, suppressor of cytokine signaling 1; FEV1, forced expiratory volume in 1 second; SEM, standard error of the mean.
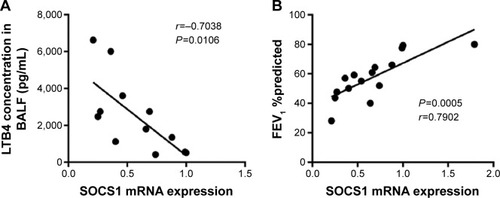
Figure 6 Expression of SOCS1, LTB4, TNF-α, and IL-6 in CSE-treated RAW264.7 cells.
Notes: Total RNA isolated from RAW264.7 cells after 0, 6, 12, and 24 hours treated with CSE was examined. The expression of mRNA was assessed by real-time PCR (A). The supernatant was collected at 0, 6, 12, and 24 hours, and the amount of TNF-α, LTB4, and IL-6 released was measured by ELISA (B–D). Whole-cell extracts from 0, 12, and 24 hours cultures were isolated and subjected to Western blot to detect the expression of SOCS1 (E). The SOCS1 expression had increased when treated with U-75302 at 24 h (F). Data were expressed as mean ± SEM, *P<0.05, **P<0.01, ***P<0.001, ****P<0.0001 vs control group.
Abbreviations: CSE, cigarette smoke extract; ELISA, enzyme-linked immunosorbent assay; IL-6, interleukin-6; LTB4, leukotriene B4; SOCS1, suppressor of cytokine signaling 1; TNF-α, tumor necrosis factor-α; SEM, standard error of the mean.
Abbreviations: CSE, cigarette smoke extract; ELISA, enzyme-linked immunosorbent assay; IL-6, interleukin-6; LTB4, leukotriene B4; SOCS1, suppressor of cytokine signaling 1; TNF-α, tumor necrosis factor-α; SEM, standard error of the mean.
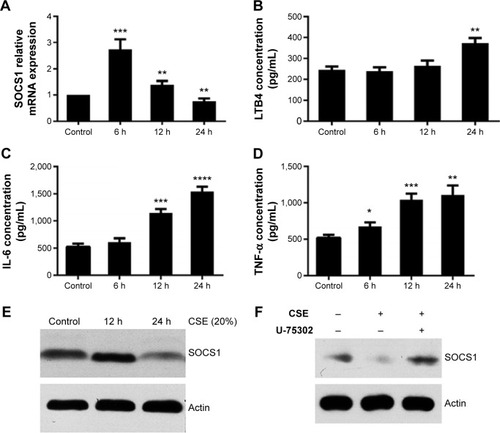
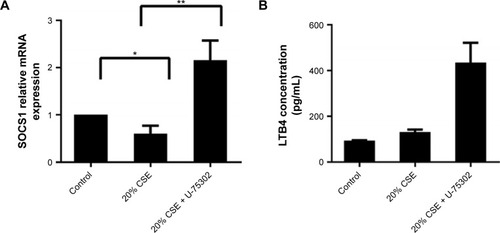
Figure 7 Effects of U-75302 on SOCS1 expression and cytokines’ secretion.
Notes: The figure shows that SOCS1 expression increased with U-75302 treatment (A); at the same time, IL-6 and TNF-α secretion decreased (C and D); however, the level of LTB4 had notable increase (B). Data are expressed as mean ± SEM, *P<0.05, **P<0.01 vs control.
Abbreviations: LTB4, leukotriene B4; IL-8, interleukin-8; SOCS1, suppressor of cytokine signaling 1; TNF-α, tumor necrosis factor-α; SEM, standard error of the mean.
Abbreviations: LTB4, leukotriene B4; IL-8, interleukin-8; SOCS1, suppressor of cytokine signaling 1; TNF-α, tumor necrosis factor-α; SEM, standard error of the mean.