Figures & data
Table 1 Baseline characteristics of the study population
Figure 1 Adjusted Kaplan–Meier curves for exacerbation for GOLD 2011 (A), GOLD 2007 (B), mMRC quartiles (C), SGRQ quartiles (D), and BOD quartiles (E).
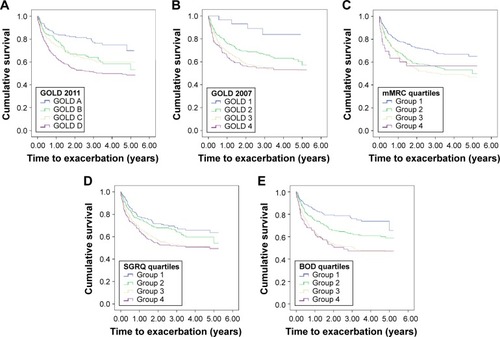
Figure 2 Adjusted Kaplan–Meier curves for mortality for GOLD 2011 (A), GOLD 2007 (B), mMRC quartiles (C), SGRQ quartiles (D), and BOD quartiles (E).
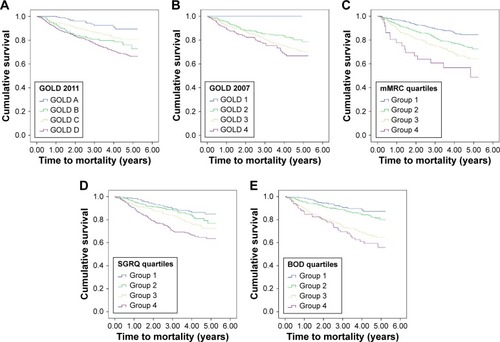
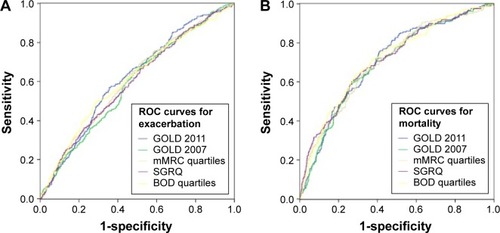
Figure 3 ROC curves for the five classification systems (GOLD 2011, GOLD 2007, mMRC, SGRQ, and BOD) for exacerbation (AUCs were 0.62±0.02, 0.59±0.02, 0.61±0.02, 0.60±0.02, and 0.61±0.02, respectively; (A)) and mortality (AUCs were 0.71±0.02, 0.70±0.02, 0.71±0.02, 0.71±0.02, and 0.72±0.02, respectively; (B)), with no significant difference demonstrated in the predictive abilities of all five systems (P>0.05).