
Figures & data
Table 1 Demographic characteristics of the participants
Table 2 Clinical characteristics of the participants
Table 3 HADS questionnaire scores
Figure 1 The mean changes in HADS scores from baseline to (A) 4 weeks and (B) 12 weeks.
Abbreviations: HADS, Hospital Anxiety and Depression Scale; ICS, inhaled corticosteroid; LABA, long-acting β2 agonist; LAMA, long-acting muscarinic antagonist.
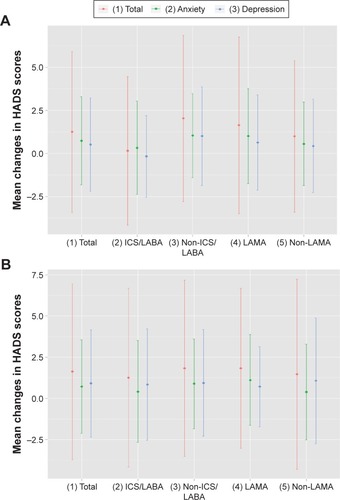
Table 4 GLMM model to evaluate the association between treatment and changes in HADS, anxiety, and depression scores