Figures & data
Table 1 Patient demographics data expressed as mean (SD)
Figure 1 LPS pre-stimulation results in differential desensitization of cytokine and chemokine release following subsequent LPS stimulation. Alveolar macrophages from smoking controls (n=7) and COPD patients (n=9) were cultured in media (M) or LPS (L) (1 μg/mL) for 24 hours before washing and restimulating in the presence or absence of LPS for further 24 hours. Supernatants were removed and TNFα (A), CCL5 (B), IL-10 (C), CXCL8 (D), and IL-6 (E) were quantified. Paired t-tests were carried out to compare conditions ML versus LL and LL versus LM. Bars indicate statistical significance was reached. *p<0.05 and **p<0.01.
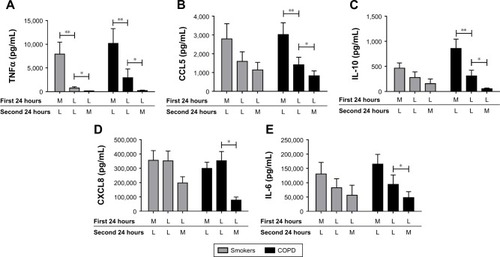
Figure 2 TLR2 pre-stimulation results in differential desensitization of cytokine and chemokine release following subsequent TLR2 stimulation. Alveolar macrophages from COPD (n=8) patients were cultured in media (M) or Pam3CSK4 (P) (0.1 μg/mL) for 24 hours before washing and restimulating in the presence or absence of Pam3CSK4 (0.1 μg/mL) for further 24 hours. Supernatants were removed and TNFα (A), CCL5 (B), IL-10 (C), CXCL8 (D), and IL-6 (E) were quantified. Paired t-tests were carried out to compare PP versus MP and PP versus PM. Bars indicate statistical significance was reached. *p<0.05 and **p<0.01.
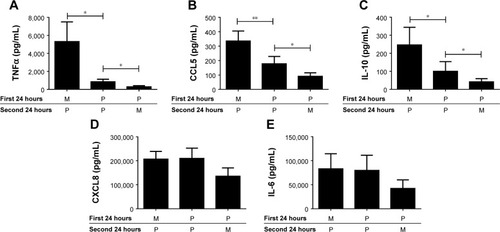
Figure 3 LPS tolerance results in the differential desensitization of TNFα and CXCL8 gene expression. COPD alveolar macrophages were cultured in media or LPS (1 μg/mL) for 24 hours before washing and restimulating with LPS (1 μg/mL) for further 4 or 24 hours as indicated. Cells were harvested in TRIzol and TNFα (A) and CXCL8 (B) gene expression was measured by qPCR and normalized to GAPDH levels (n=6). Data show mean ± SEM fold induction compared to non-stimulated time-matched controls. Paired t-tests were carried out to compare each condition to ML. **p<0.01.
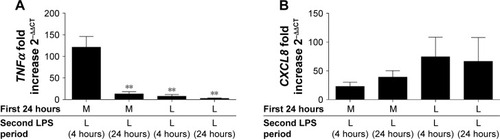
Figure 4 The effects of LPS, Pam3CSK4, and UPLPS on TLR2 and TLR4 expression. COPD alveolar macrophages were left untreated or stimulated with LPS (1 μg/mL; n=6) (A), Pam3CSK4 (0.1 μg/mL) (B), or UPLPS (0.1 μg/mL; n=5 different donors) (C) for 4, 6, 24, and 48 hours. TLR2 and TLR4 gene expression was measured by qPCR and fold change was normalized to GAPDH. Paired t-tests were carried out to compare fold induction to unstimulated time-matched controls. *,**Indicates significantly increased above unstimulated time-matched control (p<0.05 and p<0.01, respectively). #,##Indicates significantly decreased below unstimulated time-matched control (p<0.05 and p<0.01, respectively).
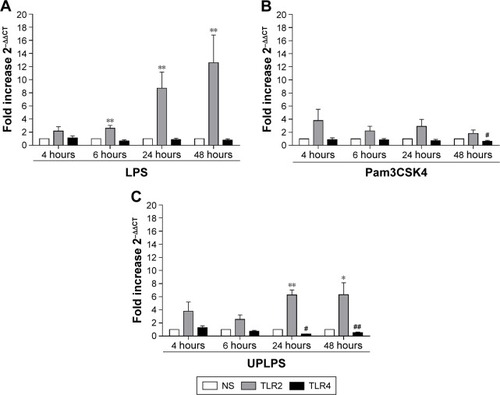
Figure 5 LPS pre-stimulation enhances the effect of Pam3CSK4 on the production of IL-6, IL-10, CXCL8, and CCL5. COPD (n=8) alveolar macrophages were cultured in media (M), Pam3CSK4 (P) (0.1 μg/mL), or LPS (L) (1 μg/mL) for 24 hours before washing and restimulating in the presence or absence of M or Pam3CSK4 (0.1 μg/mL) for further 24 hours. Supernatants were removed and TNFα (A), CCL5 (B), IL-10 (C), CXCL8 (D) and IL-6 (E) were quantified. Paired t-tests were carried out to compare MP versus LP and LM versus LP. Bars indicate statistical significance was reached, *p<0.05.
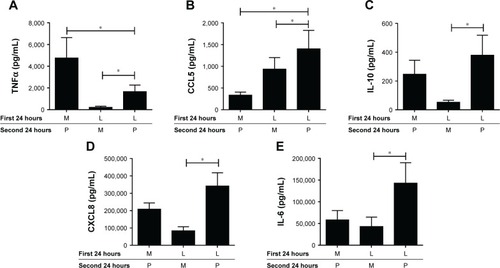
Figure S1 Alveolar macrophages from smokers (n=7) and COPD patients (n=9) were cultured in media (M) for 24 hours before washing and replacing media (M) or stimulating with LPS (1 μg/mL) (L) for further 24 hours. Supernatants were removed and TNFα (A), CCL5 (B), IL-10 (C), CXCL8 (D), and IL-6 (E) were quantified. Paired and unpaired t-tests were carried out to compare MM and ML within and between subject groups, respectively. Bars indicate statistical significance was reached. *p<0.05, **p<0.01, ***p<0.001.
Abbreviations: LPS, lipopolysaccharide; TNF, tumor necrosis factor.
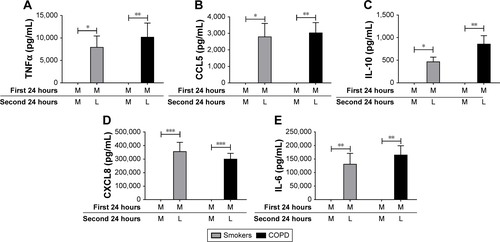
Figure S2 Alveolar macrophages from COPD patients (n=8) were cultured in media (M) for 24 hours before washing and replacing media (M) or stimulating with Pam3CSK4 (0.1 μg/mL) (P) for further 24 hours. Supernatants were removed and TNFα (A), CCL5 (B), IL-10 (C), CXCL8 (D), and IL-6 (E) were quantified. Paired t-tests were carried out to compare MM and MP. Bars indicate statistical significance was reached. *p<0.05, **p<0.01, ***p<0.001.
Abbreviations: LPS, lipopolysaccharide; TNF, tumor necrosis factor.
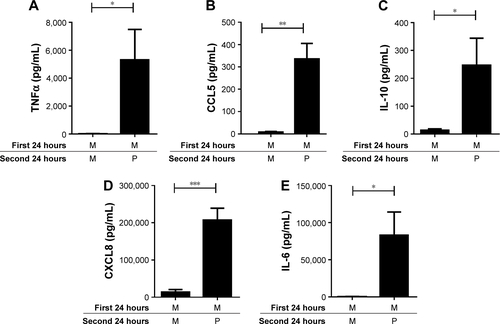
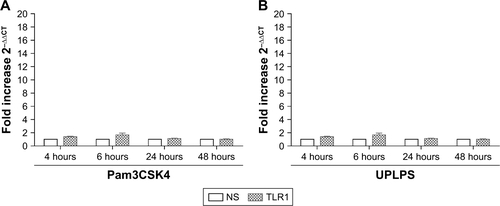
Figure S3 The effects of Pam3CSK4 and UPLPS on TLR1 expression. COPD alveolar macrophages were left untreated or stimulated with Pam3CSK4 (0.1 μg/mL) (A) or UPLPS (0.1 μg/mL) (B) (n=5) for 4, 6, 24, and 48 hours. TLR1 gene expression was measured by qPCR and fold change was normalized to GAPDH. Paired t-tests were carried out to compare fold induction to unstimulated time-matched controls.
Abbreviations: TLR, Toll-like receptor; NS, no stimulation.