Figures & data
Table 1 Patient characteristics and the severity of COPD
Table 2 Comparison of pulmonary function among groups with different severity of COPD
Table 3 Univariate analysis of risk factors associated with recurrence-free survival
Table 4 Multivariate analysis of risk factors for recurrence-free survival with proportional hazard model
Figure 1 Kaplan–Meier survival curves of recurrence-free survival for the whole study population.
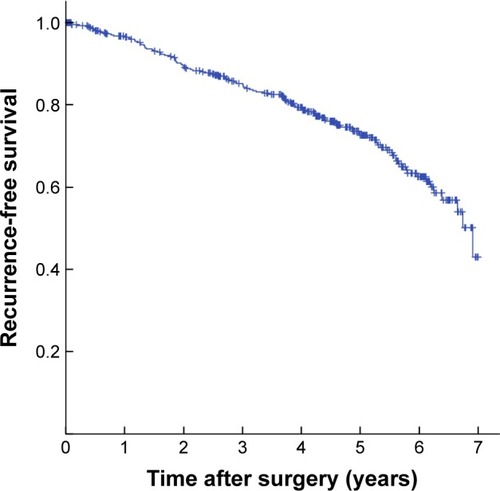
Figure 2 Kaplan-Meier curves for recurrence-free survival stratified by COPD.
Notes: (A) Kaplan–Meier survival curves for patients with NSCLC according to the presence of COPD (P=0.002). (B) Kaplan–Meier survival curves for patients with pathological stage I NSCLC according to the presence of COPD (P=0.003).
Abbreviations: COPD, chronic obstructive pulmonary disease; NSCLC, non-small-cell lung cancer.
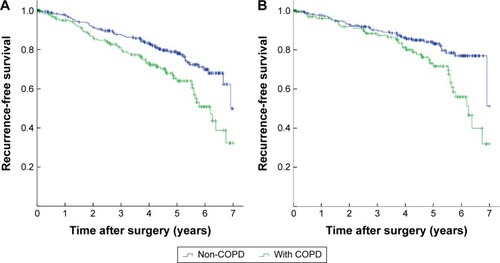
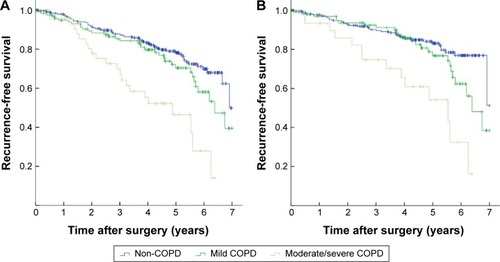
Figure 3 Kaplan-Meier curves for recurrence-free survival stratified by COPD severity.
Abbreviations: COPD, chronic obstructive pulmonary disease; NSCLC, non-small-cell lung cancer.