
Figures & data
Table 1 Baseline characteristics of public hospitals (PHs) and pulmonologists
Table 2 Allocation of COPD-related health resources in three levels of public hospitals (PHs) in 2009 and 2013
Table 3 Accuracy rate (AR) of every question of physicians in three levels of public hospitals (PHs) in 2013
Figure 1 Scores of COPD knowledge questionnaire based on educational levels of different pulmonologists in 2013.
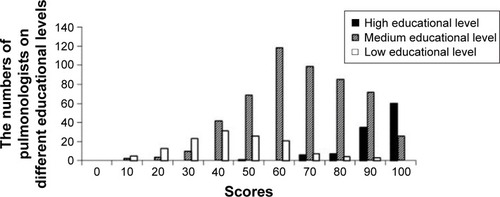
Figure 2 Scores of COPD knowledge questionnaire based on professional titles of different pulmonologists in 2013.
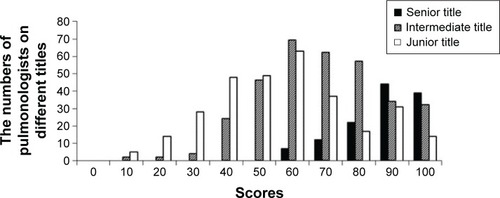
Table 4 Accuracy rate (AR) of every question of physicians between the control group and the intervention group in six second-level PHs
Table 5 Doubtful diagnosis and diagnosis ratio of COPD between the control group and the intervention group during three periods in six second-level PHs